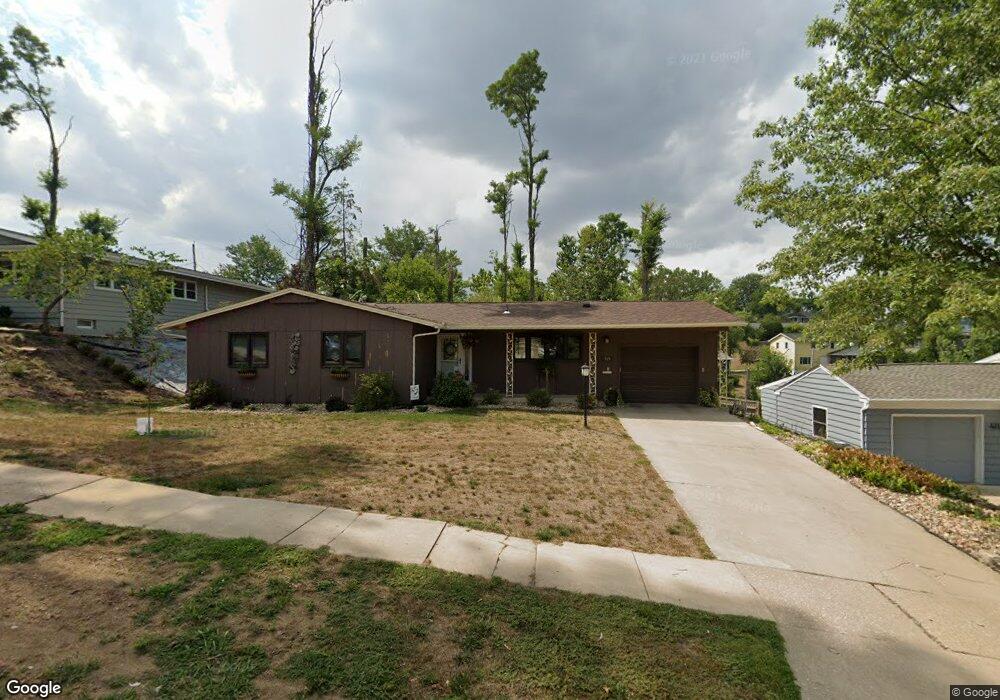
419 Red Fox Rd SE Cedar Rapids, IA 52403
Estimated Value: $229,000 - $239,000
3
Beds
2
Baths
1,592
Sq Ft
$147/Sq Ft
Est. Value
About This Home
This home is located at 419 Red Fox Rd SE, Cedar Rapids, IA 52403 and is currently estimated at $233,538, approximately $146 per square foot. 419 Red Fox Rd SE is a home located in Linn County with nearby schools including Erskine Elementary School, McKinley STEAM Academy, and George Washington High School.
Ownership History
Date
Name
Owned For
Owner Type
Purchase Details
Closed on
Apr 4, 2013
Sold by
Faaborg Joshua R and Faaborg Leigh E
Bought by
Byard Sandra L
Current Estimated Value
Home Financials for this Owner
Home Financials are based on the most recent Mortgage that was taken out on this home.
Original Mortgage
$110,800
Outstanding Balance
$78,174
Interest Rate
3.46%
Mortgage Type
New Conventional
Estimated Equity
$155,364
Purchase Details
Closed on
Mar 17, 2011
Sold by
Kenney Mary Ellen
Bought by
Faaborg Joshua R and Christensen Leigh E
Home Financials for this Owner
Home Financials are based on the most recent Mortgage that was taken out on this home.
Original Mortgage
$116,100
Interest Rate
4.25%
Mortgage Type
New Conventional
Create a Home Valuation Report for This Property
The Home Valuation Report is an in-depth analysis detailing your home's value as well as a comparison with similar homes in the area
Purchase History
| Date | Buyer | Sale Price | Title Company |
|---|---|---|---|
| Byard Sandra L | $138,500 | None Available | |
| Faaborg Joshua R | $128,500 | None Available |
Source: Public Records
Mortgage History
| Date | Status | Borrower | Loan Amount |
|---|---|---|---|
| Open | Byard Sandra L | $110,800 | |
| Previous Owner | Faaborg Joshua R | $116,100 |
Source: Public Records
Tax History
| Year | Tax Paid | Tax Assessment Tax Assessment Total Assessment is a certain percentage of the fair market value that is determined by local assessors to be the total taxable value of land and additions on the property. | Land | Improvement |
|---|---|---|---|---|
| 2025 | $3,362 | $210,000 | $48,800 | $161,200 |
| 2024 | $3,568 | $209,400 | $48,800 | $160,600 |
| 2023 | $3,568 | $200,500 | $48,800 | $151,700 |
| 2022 | $3,104 | $178,000 | $38,200 | $139,800 |
| 2021 | $3,318 | $158,800 | $38,200 | $120,600 |
| 2020 | $3,318 | $159,000 | $33,900 | $125,100 |
| 2019 | $2,978 | $146,700 | $33,900 | $112,800 |
| 2018 | $2,892 | $146,700 | $33,900 | $112,800 |
| 2017 | $2,964 | $144,600 | $33,900 | $110,700 |
| 2016 | $3,023 | $142,200 | $33,900 | $108,300 |
| 2015 | $3,065 | $144,012 | $33,920 | $110,092 |
| 2014 | $2,880 | $140,443 | $33,920 | $106,523 |
| 2013 | $2,738 | $140,443 | $33,920 | $106,523 |
Source: Public Records
Map
Nearby Homes
- 2403 Kestrel Dr SE
- 2226 Kestrel Dr SE
- 3112 Peregrine Ct SE
- 2306 Kestrel Dr SE
- 2420 Kestrel Dr SE
- 2409 Kestrel Dr SE
- 2421 Kestrel Dr SE
- 2221 Kestrel Dr SE
- 2319 Kestrel Dr SE
- 2415 Kestrel Dr SE
- 2325 Kestrel Dr SE
- 2313 Kestrel Dr SE
- 2307 Kestrel Dr SE
- 2312 Kestrel Dr SE
- 2427 Kestrel Dr SE
- 2416 Kestrel Dr SE
- 3100 Peregrine Ct SE
- 2215 Kestrel Dr SE
- 2300 Kestrel Dr SE
- 2301 Kestrel Dr SE
- 425 Red Fox Rd SE
- 3862 Lost Valley Rd SE
- 407 Red Fox Rd SE
- 3864 Lost Valley Rd SE
- 431 Red Fox Rd SE
- 3860 Lost Valley Rd SE
- 401 Red Fox Rd SE
- 418 Red Fox Rd SE
- 412 Red Fox Rd SE
- 424 Red Fox Rd SE
- 3858 Lost Valley Rd SE
- 406 Red Fox Rd SE
- 3866 Lost Valley Rd SE
- 437 Red Fox Rd SE
- 395 Red Fox Rd SE
- 436 Red Fox Rd SE
- 3856 Lost Valley Rd SE
- 3867 Lost Valley Rd SE
- 3868 Lost Valley Rd SE
- 3861 Lost Valley Rd SE
Your Personal Tour Guide
Ask me questions while you tour the home.