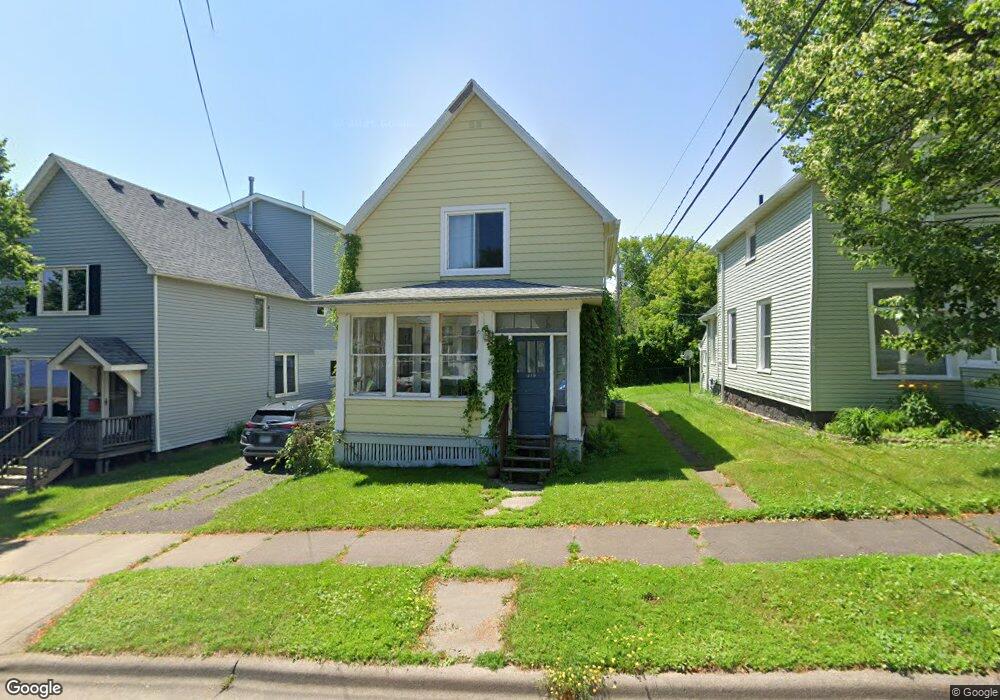
419 S 19th Ave E Duluth, MN 55812
Endion NeighborhoodEstimated Value: $208,000 - $603,000
3
Beds
1
Bath
1,232
Sq Ft
$267/Sq Ft
Est. Value
About This Home
This home is located at 419 S 19th Ave E, Duluth, MN 55812 and is currently estimated at $328,543, approximately $266 per square foot. 419 S 19th Ave E is a home located in St. Louis County with nearby schools including Congdon Elementary School, Ordean East Middle School, and East High School.
Ownership History
Date
Name
Owned For
Owner Type
Purchase Details
Closed on
Aug 11, 2014
Sold by
Guyer Laureen M and Saunders William
Bought by
Guyer Laureen M
Current Estimated Value
Purchase Details
Closed on
Sep 30, 2008
Sold by
Greenpoint Mortgage Funding
Bought by
Guyer Laureen M and Saunders William J
Home Financials for this Owner
Home Financials are based on the most recent Mortgage that was taken out on this home.
Original Mortgage
$60,000
Outstanding Balance
$37,405
Interest Rate
5.5%
Mortgage Type
Construction
Estimated Equity
$291,138
Purchase Details
Closed on
Dec 20, 2007
Sold by
Erickson Kim V and Erickson Leonard
Bought by
Greenpoint Mortgage Funding
Purchase Details
Closed on
Oct 29, 2001
Sold by
Anderson Nancy H and Anderson William J
Bought by
Erickson Leonard and Erickson Kim
Home Financials for this Owner
Home Financials are based on the most recent Mortgage that was taken out on this home.
Original Mortgage
$52,000
Interest Rate
6.62%
Create a Home Valuation Report for This Property
The Home Valuation Report is an in-depth analysis detailing your home's value as well as a comparison with similar homes in the area
Home Values in the Area
Average Home Value in this Area
Purchase History
| Date | Buyer | Sale Price | Title Company |
|---|---|---|---|
| Guyer Laureen M | -- | None Available | |
| Guyer Laureen M | $54,200 | Consolidated | |
| Greenpoint Mortgage Funding | $79,000 | None Available | |
| Erickson Leonard | $35,000 | Consolidated Title & Abstrac |
Source: Public Records
Mortgage History
| Date | Status | Borrower | Loan Amount |
|---|---|---|---|
| Open | Guyer Laureen M | $60,000 | |
| Previous Owner | Erickson Leonard | $52,000 |
Source: Public Records
Tax History
| Year | Tax Paid | Tax Assessment Tax Assessment Total Assessment is a certain percentage of the fair market value that is determined by local assessors to be the total taxable value of land and additions on the property. | Land | Improvement |
|---|---|---|---|---|
| 2024 | $1,844 | $161,700 | $72,200 | $89,500 |
| 2023 | $1,844 | $165,700 | $72,200 | $93,500 |
| 2022 | $1,418 | $191,500 | $68,400 | $123,100 |
| 2021 | $1,220 | $109,300 | $61,900 | $47,400 |
| 2020 | $1,254 | $99,300 | $56,300 | $43,000 |
| 2019 | $1,246 | $99,300 | $56,300 | $43,000 |
| 2018 | $1,154 | $99,300 | $56,300 | $43,000 |
| 2017 | $1,158 | $99,300 | $56,300 | $43,000 |
| 2016 | $1,102 | $94,300 | $52,500 | $41,800 |
| 2015 | $1,118 | $68,800 | $38,200 | $30,600 |
| 2014 | $1,118 | $68,800 | $38,200 | $30,600 |
Source: Public Records
Map
Nearby Homes
- 1928 Jefferson St
- 1901 E Superior St
- 1905 E Superior St
- 2100 Water St Unit W307
- 10 S 16th Ave E
- 1914 E 1st St
- 2126- L205 Water St
- 1616 E 1st St
- 1426 E 1st St
- 2101 E 1st St
- xxx E 2nd St
- 1723 E 4th St
- 1324 E 2nd St
- 1316 E 2nd St
- 1211 E 1st St
- 2123 E 4th St
- 2328 E 3rd St
- 2510 E Superior St
- 2415 E 2nd St
- 2514 E Superior St
- 423 S 19th Ave E
- 413 S 19th Ave E
- 413 S 19th Ave E
- 409 S 19th Ave E
- 1821 South St
- 1825 South St
- 1827 South St
- 1827 South St
- 1817 South St
- 1826 London Rd
- 1828 London Rd
- 1815 South St
- 1819 South St
- 1811 South St
- 1902 London Rd
- 418 S 19th Ave E
- 420 S 19th Ave E
- 418 S 18th Ave E
- 418 S 18th Ave E
- XX South St
Your Personal Tour Guide
Ask me questions while you tour the home.