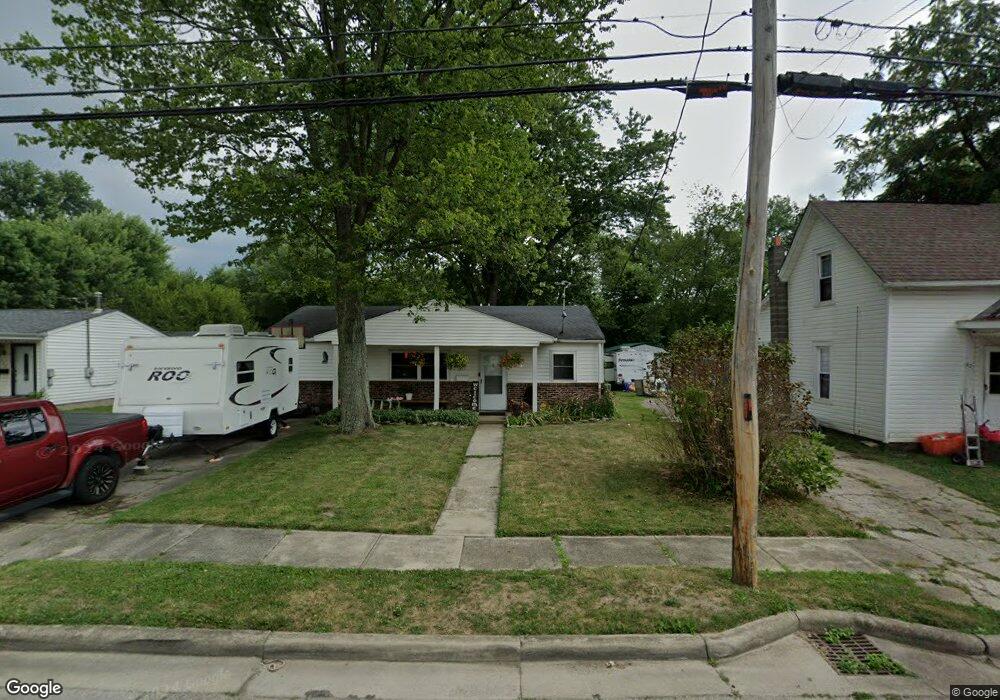
419 S Wright St Blanchester, OH 45107
Estimated Value: $150,306 - $176,000
2
Beds
1
Bath
784
Sq Ft
$210/Sq Ft
Est. Value
About This Home
This home is located at 419 S Wright St, Blanchester, OH 45107 and is currently estimated at $164,577, approximately $209 per square foot. 419 S Wright St is a home located in Clinton County with nearby schools including Putman Elementary School, Blanchester Middle School, and Blanchester High School.
Ownership History
Date
Name
Owned For
Owner Type
Purchase Details
Closed on
Oct 26, 2018
Sold by
Aills Barry and Aills Constance Sue
Bought by
Steward Timothy L and Steward Misty
Current Estimated Value
Home Financials for this Owner
Home Financials are based on the most recent Mortgage that was taken out on this home.
Original Mortgage
$89,082
Outstanding Balance
$78,441
Interest Rate
5.25%
Mortgage Type
FHA
Estimated Equity
$86,136
Purchase Details
Closed on
Jun 24, 2004
Sold by
Steward Opal A and Steward Timothy L
Bought by
Steward Opal A and Steward Timothy L
Purchase Details
Closed on
Mar 5, 1998
Sold by
Steward Allen L and Steward Opal A
Bought by
Steward Allen L and Steward Opal A
Create a Home Valuation Report for This Property
The Home Valuation Report is an in-depth analysis detailing your home's value as well as a comparison with similar homes in the area
Home Values in the Area
Average Home Value in this Area
Purchase History
| Date | Buyer | Sale Price | Title Company |
|---|---|---|---|
| Steward Timothy L | -- | None Available | |
| Steward Opal A | -- | -- | |
| Steward Allen L | -- | -- |
Source: Public Records
Mortgage History
| Date | Status | Borrower | Loan Amount |
|---|---|---|---|
| Open | Steward Timothy L | $89,082 |
Source: Public Records
Tax History
| Year | Tax Paid | Tax Assessment Tax Assessment Total Assessment is a certain percentage of the fair market value that is determined by local assessors to be the total taxable value of land and additions on the property. | Land | Improvement |
|---|---|---|---|---|
| 2024 | $1,216 | $34,510 | $4,760 | $29,750 |
| 2023 | $1,291 | $34,510 | $4,760 | $29,750 |
| 2022 | $1,059 | $25,620 | $4,100 | $21,520 |
| 2021 | $1,110 | $25,620 | $4,100 | $21,520 |
| 2020 | $1,106 | $25,620 | $4,100 | $21,520 |
| 2019 | $902 | $20,240 | $4,100 | $16,140 |
| 2018 | $905 | $20,240 | $4,100 | $16,140 |
| 2017 | $443 | $20,240 | $4,100 | $16,140 |
| 2016 | $718 | $17,190 | $4,100 | $13,090 |
| 2015 | $718 | $17,190 | $4,100 | $13,090 |
| 2013 | $740 | $17,190 | $4,100 | $13,090 |
Source: Public Records
Map
Nearby Homes
- 501 S Wright St
- 503 S Broadway St
- 0 Ohio 123 Unit 11 938995
- 0 Ohio 123 Unit 1848086
- 308 S Broadway St
- 143 W Fancy St
- 203 E Main St
- 305 E Main St
- 112 W Baldwin St
- 502 Railroad St
- 308 Lazenby St
- 507 Bourbon St
- 501 E Johns St
- 816 E Center St
- 1 Middleboro Rd
- 7403 Fairground Rd
- 7636 Rosewood Dr
- 117 Pansy Pike
- 5000 Sean Cir
- 5002 Sean Cir
- 417 S Wright St
- 421 S Wright St
- 423 S Wright St
- 409 S Wright St
- 425 S Wright St
- 407 S Wright St
- 418 S Wright St
- 416 S Wright St
- 427 S Wright St
- 414 S Wright St
- 422 S Wright St
- 410 S Wright St
- 405 S Wright St
- 408 S Wright St
- 505 S Wright St
- 239 Old South Broadway St
- 235 S Broadway St
- 205 E Burroughs St
- 231 Old South Broadway St
- 402 S Wright St
Your Personal Tour Guide
Ask me questions while you tour the home.