N
Seller's Agent in 2019
Noelle Galper
HomeSmart
(770) 333-9972
6 Total Sales
Estimated Value: $735,559 - $823,000
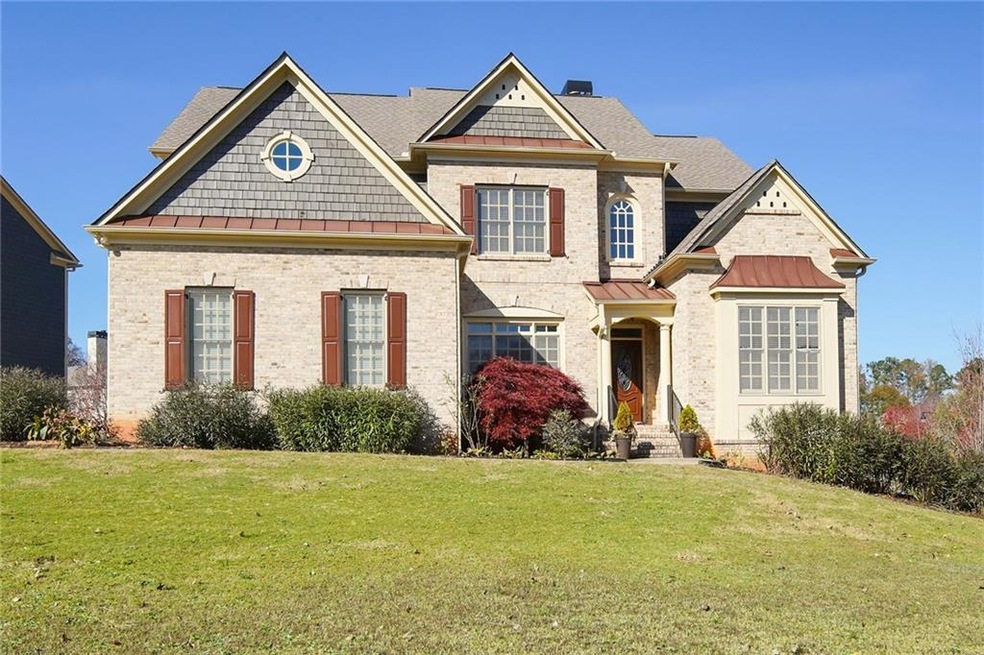
The king of the hill in this super convenient swim/tennis neighborhood. 2 full kitchens with granite & stainless appliances. Daylight basement with exterior entrance has full kitchen with bar top, coffered ceiling den and exercise/bonus space, bedroom, full bath, and office/other room. Main level features kitchen, coffered den, living room, dining room, bedroom, full bath and office. Upper level 3 more beds each with full bath plus loft area. All this with 3 sides brick and a huge back patio on a large corner lot. Public records have basement sq ft wrong.
| Date | Buyer | Sale Price | Title Company |
|---|---|---|---|
| Hoover William T | $485,000 | -- | |
| Sagre Investment Grp Llc | $362,250 | -- | |
| Hsbc Bank Usa National Association Trust | -- | -- | |
| Montanocordoba James | -- | -- | |
| Montanocordoba James | $532,900 | -- |
| Date | Status | Borrower | Loan Amount |
|---|---|---|---|
| Open | Hoover William T | $388,000 | |
| Previous Owner | Montanocordoba James | $426,315 |
| Date | Event | Price | List to Sale | Price per Sq Ft | Prior Sale |
|---|---|---|---|---|---|
| 02/22/2019 02/22/19 | Sold | $485,000 | -2.0% | $134 / Sq Ft | |
| 01/18/2019 01/18/19 | Pending | -- | -- | -- | |
| 01/17/2019 01/17/19 | Price Changed | $495,000 | -1.0% | $136 / Sq Ft | |
| 12/10/2018 12/10/18 | For Sale | $499,900 | 0.0% | $138 / Sq Ft | |
| 12/02/2018 12/02/18 | Pending | -- | -- | -- | |
| 11/26/2018 11/26/18 | For Sale | $499,900 | +38.0% | $138 / Sq Ft | |
| 07/30/2018 07/30/18 | Sold | $362,250 | -30.3% | $88 / Sq Ft | View Prior Sale |
| 06/30/2018 06/30/18 | Pending | -- | -- | -- | |
| 06/14/2018 06/14/18 | For Sale | $520,000 | -- | $126 / Sq Ft |
| Year | Tax Paid | Tax Assessment Tax Assessment Total Assessment is a certain percentage of the fair market value that is determined by local assessors to be the total taxable value of land and additions on the property. | Land | Improvement |
|---|---|---|---|---|
| 2025 | $7,990 | $304,864 | $46,000 | $258,864 |
| 2024 | $7,996 | $304,864 | $46,000 | $258,864 |
| 2023 | $7,454 | $304,864 | $46,000 | $258,864 |
| 2022 | $7,282 | $269,552 | $40,000 | $229,552 |
| 2021 | $6,382 | $228,444 | $40,000 | $188,444 |
| 2020 | $5,614 | $194,000 | $39,640 | $154,360 |
| 2019 | $5,939 | $195,676 | $40,000 | $155,676 |
| 2018 | $5,661 | $195,676 | $40,000 | $155,676 |
| 2017 | $5,066 | $185,128 | $38,000 | $147,128 |
| 2016 | $5,067 | $185,128 | $38,000 | $147,128 |
| 2015 | $5,194 | $185,128 | $38,000 | $147,128 |
| 2014 | $4,201 | $150,216 | $0 | $0 |
N
Seller's Agent in 2019
Noelle Galper
HomeSmart
(770) 333-9972
6 Total Sales

Buyer's Agent in 2019
Meko Fountain
Compass
(678) 358-2589
7 in this area
406 Total Sales
Seller's Agent in 2018
Cheri Benjamin
Real Broker, LLC.
(678) 458-4037
3 Total Sales
Source: First Multiple Listing Service (FMLS)
MLS Number: 6103442
APN: 17-0047-0-078-0
Disclaimer: Certain information contained herein is derived from information provided by parties other than Homes.com. All information provided is deemed reliable, but is not guaranteed to be accurate and should be independently verified.
![]() Listings identified with the FMLS IDX logo come from FMLS and are held by brokerage firms other than the owner of this website. The listing brokerage is identified in any listing details. Information is deemed reliable but is not guaranteed. If you believe any FMLS listing contains material that infringes your copyrighted work please visit www.fmls.com/dmca to review our DMCA policy and learn how to submit a takedown request. © 2025 First Multiple Listing Service, Inc.
Listings identified with the FMLS IDX logo come from FMLS and are held by brokerage firms other than the owner of this website. The listing brokerage is identified in any listing details. Information is deemed reliable but is not guaranteed. If you believe any FMLS listing contains material that infringes your copyrighted work please visit www.fmls.com/dmca to review our DMCA policy and learn how to submit a takedown request. © 2025 First Multiple Listing Service, Inc.