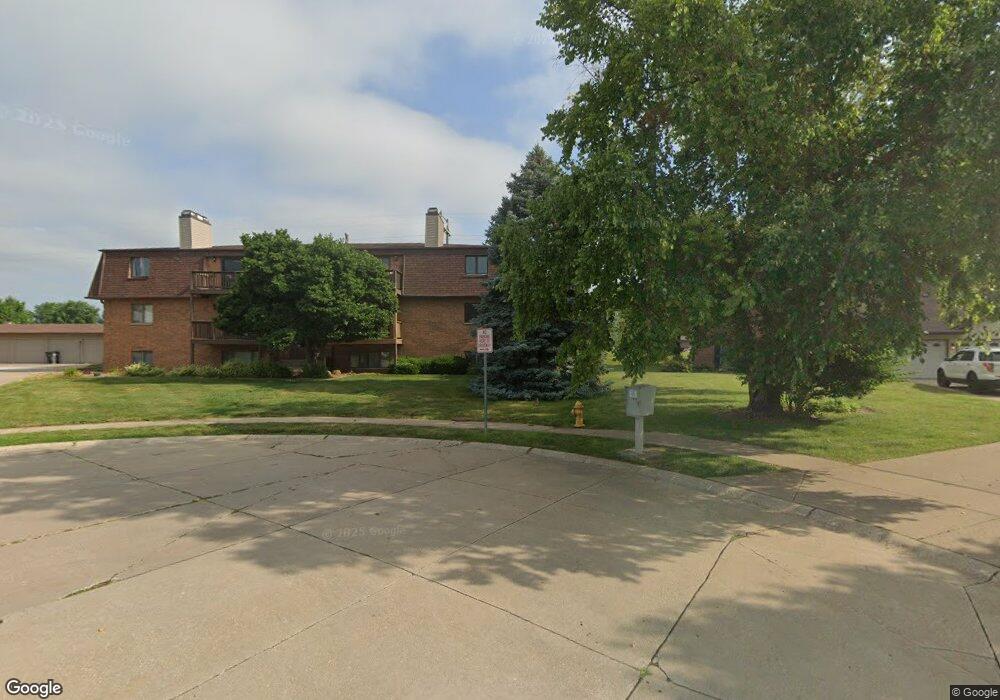
4190 Mallard Ct Unit 5 Bettendorf, IA 52722
Estimated Value: $131,000 - $150,000
2
Beds
1
Bath
881
Sq Ft
$160/Sq Ft
Est. Value
About This Home
This home is located at 4190 Mallard Ct Unit 5, Bettendorf, IA 52722 and is currently estimated at $140,775, approximately $159 per square foot. 4190 Mallard Ct Unit 5 is a home located in Scott County with nearby schools including Riverdale Heights Elementary, Pleasant Valley Junior High School, and Pleasant Valley High School.
Ownership History
Date
Name
Owned For
Owner Type
Purchase Details
Closed on
Oct 19, 2021
Sold by
Cynthia A Chesnutt Revocable Trust and Chesnutt Cynthia A
Bought by
Gosnell Caleb
Current Estimated Value
Home Financials for this Owner
Home Financials are based on the most recent Mortgage that was taken out on this home.
Original Mortgage
$88,000
Outstanding Balance
$80,168
Interest Rate
2.88%
Mortgage Type
New Conventional
Estimated Equity
$60,607
Purchase Details
Closed on
Sep 12, 2011
Sold by
Weaver Sherri L and Weaver Christopher A
Bought by
Chesnutt Dana G and Chesnutt Cynthia A
Purchase Details
Closed on
Dec 19, 2006
Sold by
Kane Jeffrey W
Bought by
Johnson Sherri L and Weaver Christopher A
Home Financials for this Owner
Home Financials are based on the most recent Mortgage that was taken out on this home.
Original Mortgage
$81,000
Interest Rate
6.36%
Mortgage Type
New Conventional
Create a Home Valuation Report for This Property
The Home Valuation Report is an in-depth analysis detailing your home's value as well as a comparison with similar homes in the area
Home Values in the Area
Average Home Value in this Area
Purchase History
| Date | Buyer | Sale Price | Title Company |
|---|---|---|---|
| Gosnell Caleb | -- | None Listed On Document | |
| Chesnutt Dana G | $82,000 | None Available | |
| Johnson Sherri L | $83,000 | None Available |
Source: Public Records
Mortgage History
| Date | Status | Borrower | Loan Amount |
|---|---|---|---|
| Open | Gosnell Caleb | $88,000 | |
| Previous Owner | Johnson Sherri L | $81,000 |
Source: Public Records
Tax History Compared to Growth
Tax History
| Year | Tax Paid | Tax Assessment Tax Assessment Total Assessment is a certain percentage of the fair market value that is determined by local assessors to be the total taxable value of land and additions on the property. | Land | Improvement |
|---|---|---|---|---|
| 2025 | $1,598 | $137,500 | $19,700 | $117,800 |
| 2024 | $1,618 | $114,000 | $9,300 | $104,700 |
| 2023 | $1,622 | $114,000 | $9,300 | $104,700 |
| 2022 | $1,604 | $97,990 | $9,300 | $88,690 |
| 2021 | $1,604 | $97,990 | $9,300 | $88,690 |
| 2020 | $1,542 | $91,460 | $9,300 | $82,160 |
| 2019 | $1,492 | $87,550 | $9,300 | $78,250 |
| 2018 | $1,458 | $87,550 | $9,300 | $78,250 |
| 2017 | $487 | $87,550 | $9,300 | $78,250 |
| 2016 | $1,618 | $85,950 | $0 | $0 |
| 2015 | $1,618 | $82,080 | $0 | $0 |
| 2014 | $1,564 | $82,080 | $0 | $0 |
| 2013 | $1,538 | $0 | $0 | $0 |
| 2012 | -- | $83,010 | $8,520 | $74,490 |
Source: Public Records
Map
Nearby Homes
- 4190 Mallard Ct Unit 10
- 3988 Partridge Cir
- 3260 Parkwild Dr Unit 3D
- 3948 Partridge Cir Unit U
- 3944 Partridge Cir Unit D
- 3845 Prairie Ln
- 4331 Augusta Ct
- 3461 Cedarview Ct
- 3542 Cedarview Ct
- 3550 Devils Glen Rd
- 3472 Cedarview Ct
- 3814 Orchard Dr
- 3820 Orchard Dr
- 3826 Orchard Dr
- 3075 Willowwood Dr
- 3439 Maple Glen Dr
- 4255 Apple Valley Dr
- 2630 Tanglefoot Ln
- 3425 N Willow Ct
- 2946 Summertree Ave
- 4190 Mallard Ct Unit 11
- 4190 Mallard Ct Unit 9
- 4190 Mallard Ct Unit 8
- 4190 Mallard Ct Unit 7
- 4190 Mallard Ct Unit 6
- 4190 Mallard Ct Unit 5
- 4190 Mallard Ct Unit 4
- 4190 Mallard Ct Unit 3
- 4190 Mallard Ct Unit 1
- 4190 Mallard Ct Unit 2
- 4190 Mallard Ct
- 4184 Mallard Ct
- 4180 Mallard Ct
- 4188 Mallard Ct
- 4176 Mallard Ct
- 4170 Mallard Ct
- 4166 Mallard Ct
- 4160 Mallard Ct
- 4165 Mallard Ct Unit 2
- 4165 Mallard Ct Unit 7