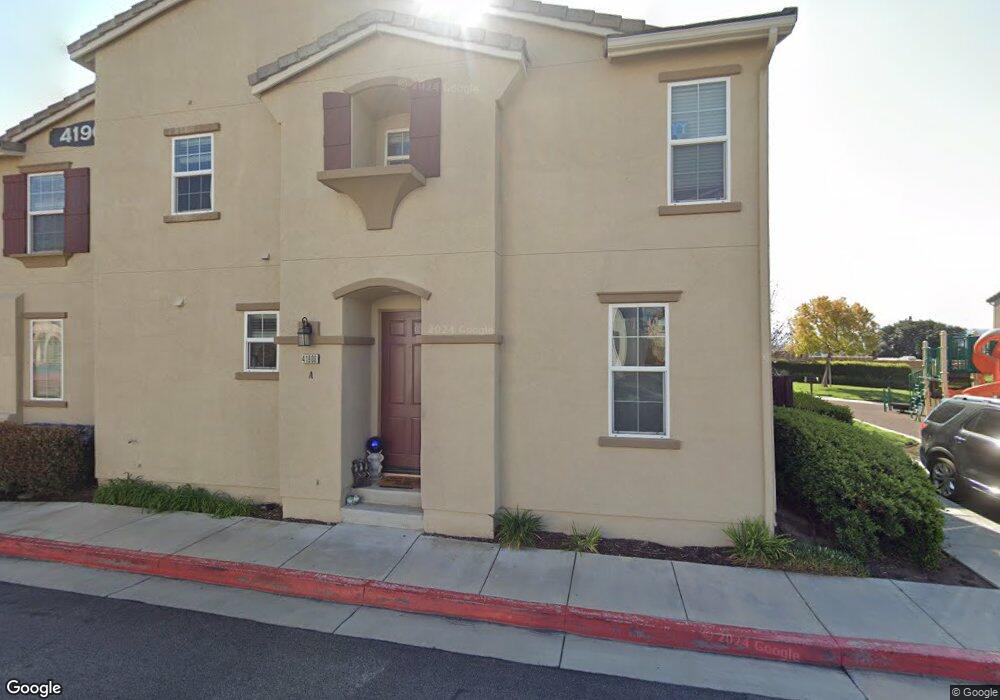
41900 Davenport Way Unit C Murrieta, CA 92562
Estimated Value: $446,000 - $449,000
2
Beds
3
Baths
1,440
Sq Ft
$310/Sq Ft
Est. Value
About This Home
This home is located at 41900 Davenport Way Unit C, Murrieta, CA 92562 and is currently estimated at $447,072, approximately $310 per square foot. 41900 Davenport Way Unit C is a home located in Riverside County with nearby schools including Murrieta Elementary School, Thompson Middle School, and Murrieta Valley High School.
Ownership History
Date
Name
Owned For
Owner Type
Purchase Details
Closed on
Jun 25, 2008
Sold by
U S Bank Na
Bought by
Ender Fred William and Ender Deanna Sue
Current Estimated Value
Purchase Details
Closed on
Sep 6, 2007
Sold by
Leon Edgar
Bought by
U S Bank Na
Purchase Details
Closed on
Sep 14, 2005
Sold by
Sams L Doyall and Sams Bonnie H
Bought by
Leon Edgar
Home Financials for this Owner
Home Financials are based on the most recent Mortgage that was taken out on this home.
Original Mortgage
$265,200
Interest Rate
6.4%
Mortgage Type
Purchase Money Mortgage
Purchase Details
Closed on
Dec 13, 2004
Sold by
A C Magnolia Llc
Bought by
Sams L Doyall and Sams Bonnie H
Home Financials for this Owner
Home Financials are based on the most recent Mortgage that was taken out on this home.
Original Mortgage
$75,000
Interest Rate
5.7%
Mortgage Type
Purchase Money Mortgage
Create a Home Valuation Report for This Property
The Home Valuation Report is an in-depth analysis detailing your home's value as well as a comparison with similar homes in the area
Home Values in the Area
Average Home Value in this Area
Purchase History
| Date | Buyer | Sale Price | Title Company |
|---|---|---|---|
| Ender Fred William | $169,000 | Stewart Title | |
| U S Bank Na | $255,000 | None Available | |
| Leon Edgar | $331,500 | Old Republic Title Company | |
| Sams L Doyall | $296,000 | Chicago Title |
Source: Public Records
Mortgage History
| Date | Status | Borrower | Loan Amount |
|---|---|---|---|
| Previous Owner | Leon Edgar | $265,200 | |
| Previous Owner | Sams L Doyall | $75,000 |
Source: Public Records
Tax History Compared to Growth
Tax History
| Year | Tax Paid | Tax Assessment Tax Assessment Total Assessment is a certain percentage of the fair market value that is determined by local assessors to be the total taxable value of land and additions on the property. | Land | Improvement |
|---|---|---|---|---|
| 2025 | $3,712 | $217,610 | $77,256 | $140,354 |
| 2023 | $3,712 | $209,161 | $74,257 | $134,904 |
| 2022 | $3,704 | $205,060 | $72,801 | $132,259 |
| 2021 | $3,658 | $201,040 | $71,374 | $129,666 |
| 2020 | $3,637 | $198,980 | $70,643 | $128,337 |
| 2019 | $3,593 | $195,079 | $69,258 | $125,821 |
| 2018 | $3,553 | $191,254 | $67,900 | $123,354 |
| 2017 | $3,568 | $187,505 | $66,569 | $120,936 |
| 2016 | $3,550 | $183,829 | $65,264 | $118,565 |
| 2015 | $3,531 | $181,070 | $64,285 | $116,785 |
| 2014 | $3,329 | $177,526 | $63,027 | $114,499 |
Source: Public Records
Map
Nearby Homes
- 41948 Pedraza St
- 24264 Washington Ave
- 41973 Rondo St Unit 1203
- 41985 #302 Emelia St
- 41978 Ornella St
- 41675 Broad Oak St
- 42025 Boothill Ln
- 24435 Adams Ave
- 24370 Adams Ave
- 42154 Thoroughbred Ln
- 41621 Valor Dr
- 0 Lenox Ln Unit NDP2509288
- 0 Lenox Ln Unit SW23101061
- 41548 Hutchison Ct
- 42133 Wagon Wheel Ln
- 41886 41886 Magnolia St
- 24409 Jefferson Ave
- 41490 Lily Ave
- 24320 Calle Estancia
- 24280 White Willow Ave
- 41900 Davenport Way Unit D
- 41900 Davenport Way Unit B
- 41900 Davenport Way Unit A
- 41880 Davenport Way
- 41880 Davenport Way Unit D
- 41880 Davenport Way Unit C
- 41880 Davenport Way Unit B
- 41880 Davenport Way Unit A
- 41905 Davenport Way Unit D
- 41905 Davenport Way Unit A
- 41905 Davenport Way Unit C
- 41920 Davenport Way
- 41920 Davenport Way Unit 4a
- 41920 Davenport Way Unit D
- 41920 Davenport Way Unit C
- 41920 Davenport Way Unit B
- 41885 Davenport Way Unit D
- 41885 Davenport Way Unit C
- 41885 Davenport Way Unit B
- 41885 Davenport Way Unit A