41905 N La Crosse Trail Phoenix, AZ 85086
Estimated Value: $913,878 - $1,037,000
3
Beds
3
Baths
3,437
Sq Ft
$288/Sq Ft
Est. Value
About This Home
This home is located at 41905 N La Crosse Trail, Phoenix, AZ 85086 and is currently estimated at $990,720, approximately $288 per square foot. 41905 N La Crosse Trail is a home located in Maricopa County with nearby schools including Diamond Canyon Elementary School and Boulder Creek High School.
Ownership History
Date
Name
Owned For
Owner Type
Purchase Details
Closed on
Jul 9, 2018
Sold by
Ritchelli Ann
Bought by
Ritchelli Frank and Ritchelli Ann
Current Estimated Value
Purchase Details
Closed on
May 18, 2009
Sold by
Ritchelli Frank
Bought by
Ritchelli Ann
Purchase Details
Closed on
May 12, 2009
Sold by
Citimortgage Inc
Bought by
Ritchelli Ann
Purchase Details
Closed on
Feb 10, 2009
Sold by
Poppa Jonathan W
Bought by
Citimortgage Inc
Purchase Details
Closed on
Apr 10, 2006
Sold by
Poppa Monica
Bought by
Poppa Jonathan W
Home Financials for this Owner
Home Financials are based on the most recent Mortgage that was taken out on this home.
Original Mortgage
$67,550
Interest Rate
6.35%
Mortgage Type
Stand Alone Second
Create a Home Valuation Report for This Property
The Home Valuation Report is an in-depth analysis detailing your home's value as well as a comparison with similar homes in the area
Home Values in the Area
Average Home Value in this Area
Purchase History
| Date | Buyer | Sale Price | Title Company |
|---|---|---|---|
| Ritchelli Frank | -- | None Available | |
| Ritchelli Ann | -- | North American Title Company | |
| Ritchelli Ann | $325,000 | North American Title Company | |
| Citimortgage Inc | $332,000 | First American Title | |
| Poppa Jonathan W | -- | Sun Title Agency Co | |
| Poppa Jonathan W | $675,545 | Sun Title Agency Co |
Source: Public Records
Mortgage History
| Date | Status | Borrower | Loan Amount |
|---|---|---|---|
| Previous Owner | Poppa Jonathan W | $67,550 | |
| Previous Owner | Poppa Jonathan W | $540,400 |
Source: Public Records
Tax History Compared to Growth
Tax History
| Year | Tax Paid | Tax Assessment Tax Assessment Total Assessment is a certain percentage of the fair market value that is determined by local assessors to be the total taxable value of land and additions on the property. | Land | Improvement |
|---|---|---|---|---|
| 2025 | $5,107 | $47,655 | -- | -- |
| 2024 | $4,738 | $45,386 | -- | -- |
| 2023 | $4,738 | $67,560 | $13,510 | $54,050 |
| 2022 | $4,549 | $47,810 | $9,560 | $38,250 |
| 2021 | $4,641 | $44,670 | $8,930 | $35,740 |
| 2020 | $4,534 | $43,070 | $8,610 | $34,460 |
| 2019 | $4,376 | $42,260 | $8,450 | $33,810 |
| 2018 | $4,213 | $39,970 | $7,990 | $31,980 |
| 2017 | $4,122 | $38,600 | $7,720 | $30,880 |
| 2016 | $3,702 | $37,650 | $7,530 | $30,120 |
| 2015 | $3,448 | $37,360 | $7,470 | $29,890 |
Source: Public Records
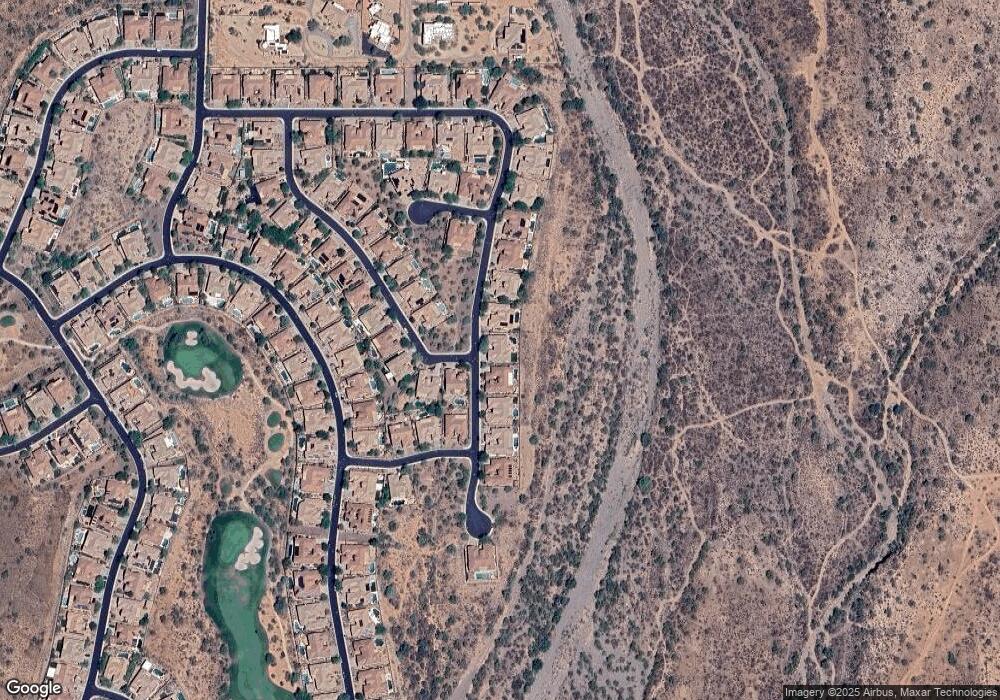
Map
Nearby Homes
- 42106 N Bradon Way
- 41607 N Club Pointe Dr
- 42032 N Club Pointe Dr
- 42041 N Mountain Cove Dr
- 41618 N Anthem Ridge Dr
- 42xxx (C) N 7th Ave
- 41318 N Club Pointe Dr
- 42605 N 6th Ave
- 41411 N Anthem Ridge Dr
- 755 W Honda Bow Rd
- 42618 N 3rd Ave
- 41809 N La Cantera Dr
- 1620 W Silver Pine Dr
- 43012 N 7th Ave
- 1320 W Whitman Dr Unit 36
- 41124 N Prestancia Dr
- 41619 N River Bend Rd
- 1435 W Whitman Ct
- 1303 W Spirit Dr
- 41601 N River Bend Rd Unit 26
- 41821 N La Crosse Trail
- 41911 N La Crosse Trail
- 41911 N La Crosse Tr
- 817 W Silver Pine Dr
- 41815 N La Crosse Trail
- 41917 N La Crosse Trail
- 41913 N Alistair Way
- 816 W Hazelhurst Dr
- 823 W Silver Pine Dr
- 42007 N La Crosse Trail
- 41919 N Alistair Way
- 822 W Hazelhurst Dr
- 41910 N Alistair Way
- 813 W Camargo Ct
- 41727 N La Crosse Ct
- 42013 N La Crosse Tr
- 41925 N Alistair Way
- 41916 N Alistair Way
- 906 W Hazelhurst Dr
- 41815 N Club Pointe Dr Unit 44