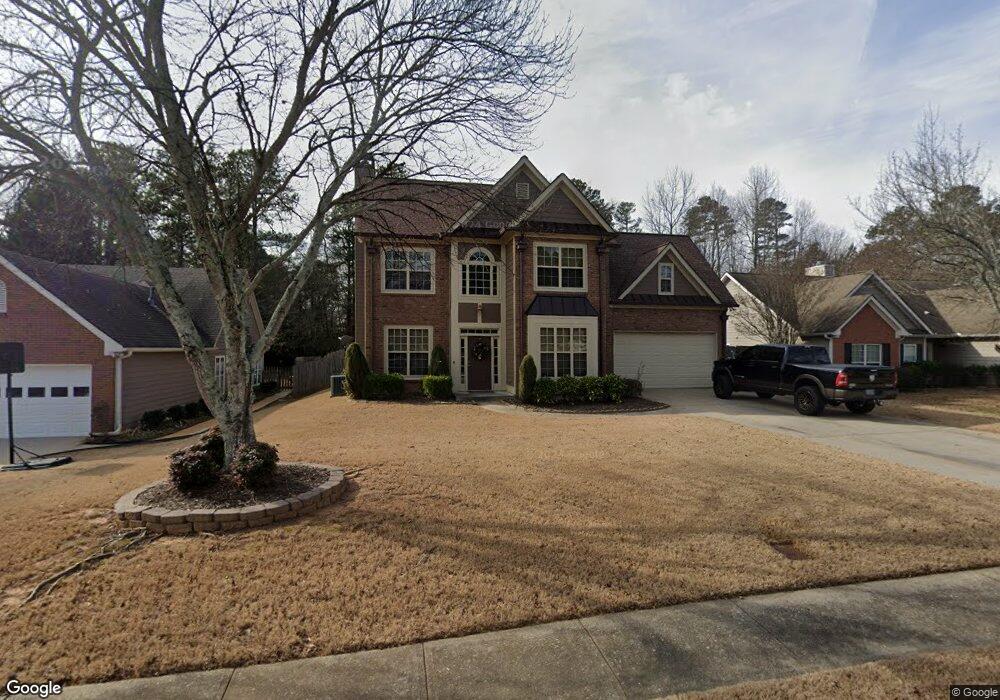
4194 Chatham Crest Ln Buford, GA 30518
Estimated Value: $461,000 - $503,000
4
Beds
3
Baths
2,533
Sq Ft
$189/Sq Ft
Est. Value
About This Home
This home is located at 4194 Chatham Crest Ln, Buford, GA 30518 and is currently estimated at $479,756, approximately $189 per square foot. 4194 Chatham Crest Ln is a home located in Gwinnett County with nearby schools including Sugar Hill Elementary School, Lanier Middle School, and Lanier High School.
Ownership History
Date
Name
Owned For
Owner Type
Purchase Details
Closed on
Apr 27, 2007
Sold by
Ameriquest Mtg Series 2006-R1
Bought by
Diaz Roberto
Current Estimated Value
Home Financials for this Owner
Home Financials are based on the most recent Mortgage that was taken out on this home.
Original Mortgage
$169,200
Outstanding Balance
$115,568
Interest Rate
8.75%
Mortgage Type
New Conventional
Estimated Equity
$364,188
Purchase Details
Closed on
Oct 3, 2006
Sold by
Delay Hardy L and Delay Ramona
Bought by
Ameriquest Mtg Securities Inc
Purchase Details
Closed on
Sep 19, 2002
Sold by
Howell Patrick A and Howell Theona S
Bought by
Delay Hardy L and Delay Ramona
Home Financials for this Owner
Home Financials are based on the most recent Mortgage that was taken out on this home.
Original Mortgage
$174,450
Interest Rate
6.27%
Mortgage Type
FHA
Purchase Details
Closed on
Nov 17, 1995
Sold by
Garen Homes Inc
Bought by
Howell Patrick Theona
Create a Home Valuation Report for This Property
The Home Valuation Report is an in-depth analysis detailing your home's value as well as a comparison with similar homes in the area
Home Values in the Area
Average Home Value in this Area
Purchase History
| Date | Buyer | Sale Price | Title Company |
|---|---|---|---|
| Diaz Roberto | $174,500 | -- | |
| Ameriquest Mtg Securities Inc | $171,000 | -- | |
| Delay Hardy L | $175,900 | -- | |
| Howell Patrick Theona | $133,500 | -- |
Source: Public Records
Mortgage History
| Date | Status | Borrower | Loan Amount |
|---|---|---|---|
| Open | Diaz Roberto | $169,200 | |
| Previous Owner | Delay Hardy L | $174,450 | |
| Closed | Howell Patrick Theona | $0 |
Source: Public Records
Tax History
| Year | Tax Paid | Tax Assessment Tax Assessment Total Assessment is a certain percentage of the fair market value that is determined by local assessors to be the total taxable value of land and additions on the property. | Land | Improvement |
|---|---|---|---|---|
| 2025 | $7,315 | $197,640 | $40,000 | $157,640 |
| 2024 | $7,090 | $189,080 | $32,000 | $157,080 |
| 2023 | $7,090 | $189,080 | $32,000 | $157,080 |
| 2022 | $6,654 | $177,640 | $26,000 | $151,640 |
| 2021 | $4,939 | $127,240 | $20,120 | $107,120 |
| 2020 | $4,784 | $127,240 | $20,120 | $107,120 |
| 2019 | $4,784 | $127,240 | $20,120 | $107,120 |
| 2018 | $4,452 | $117,680 | $18,000 | $99,680 |
| 2016 | $3,655 | $94,760 | $15,520 | $79,240 |
| 2015 | $3,017 | $75,640 | $10,800 | $64,840 |
| 2014 | $3,028 | $75,640 | $10,800 | $64,840 |
Source: Public Records
Map
Nearby Homes
- 4184 Chatham Crest Ln Unit 1
- 1877 Castleberry Ln
- 1866 Castleberry Ln
- 783 Kimball Ln
- 4249 Buford Valley Way
- 1264 Brynhill Ct
- 4180 Chatham Ridge Dr
- 870 Creekview Bluff Way
- 881 Creekview Bluff Way
- 4295 Suwanee Mill Dr
- 4169 Two Bridge Dr
- 957 Pont Du Gard Ct
- 1326 Lanier Vista Dr
- 4225 Hidden Meadow Cir
- 1669 Centerville Dr
- 4302 Burton Bend Way Unit 152
- 821 Dodd Trail
- 4306 Burton Bend Way Unit 150
- 706 Dodd Ln Unit 157
- 5426 Howington Ct Unit 185
- 4204 Chatham Crest Ln
- 4214 Chatham Crest Ln Unit 2
- 4191 Chatham Crest Ln
- 4164 Chatham Crest Ln
- 4224 Chatham Crest Ln
- 1285 Joe Brogdon Ln
- 1275 Joe Brogdon Ln
- 4251 Chatham Crest Ln
- 1282 Joe Brogdon Ln
- 4261 Chatham Crest Ln
- 4154 Chatham Crest Ln
- 4234 Chatham Crest Ln
- 1265 Joe Brogdon Ln
- 1272 Joe Brogdon Ln
- 4289 Chatham View Dr
- 4299 Chatham View Dr
- 4299 Chatham View Dr Unit 4299
- 4299 Chatham View Dr
- 4271 Chatham Crest Ln
- 4279 Chatham View Dr Unit 1
Your Personal Tour Guide
Ask me questions while you tour the home.