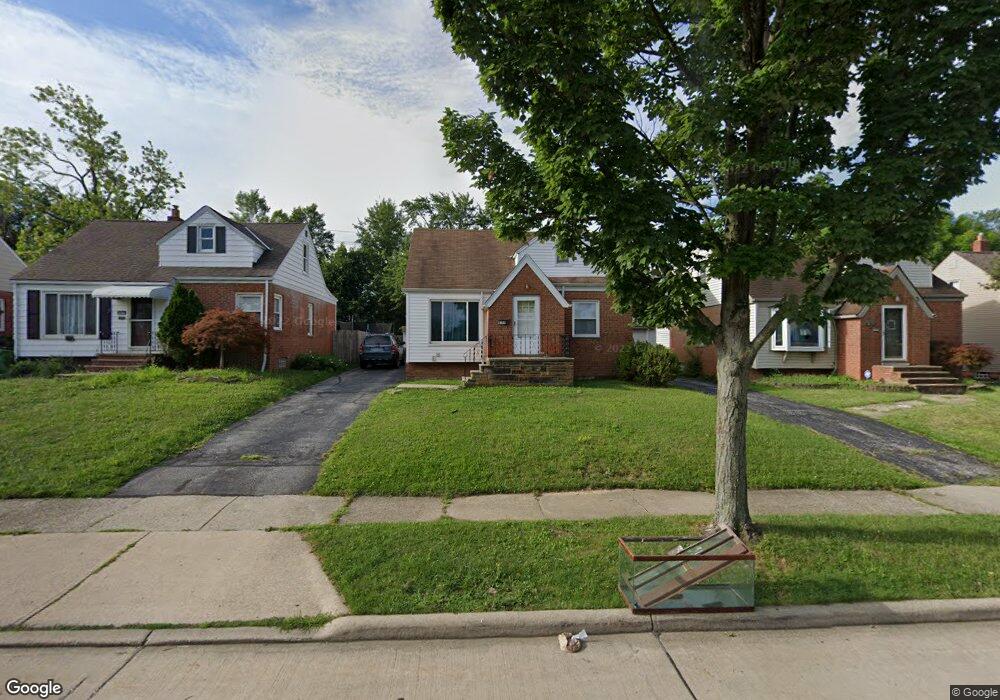
4194 Lambert Rd Cleveland, OH 44121
Estimated Value: $148,000 - $183,000
3
Beds
2
Baths
1,375
Sq Ft
$119/Sq Ft
Est. Value
About This Home
This home is located at 4194 Lambert Rd, Cleveland, OH 44121 and is currently estimated at $164,179, approximately $119 per square foot. 4194 Lambert Rd is a home located in Cuyahoga County with nearby schools including Rowland Elementary School, Greenview Upper Elementary School, and Memorial Junior High School.
Ownership History
Date
Name
Owned For
Owner Type
Purchase Details
Closed on
Feb 27, 2019
Sold by
Horizon Enterprises Llc
Bought by
Gorelick Investment Group Iv Llc
Current Estimated Value
Purchase Details
Closed on
Aug 10, 2012
Sold by
Horizon Enterprises
Bought by
Horizon Enterprises Llc
Purchase Details
Closed on
Jul 15, 1986
Bought by
Horizon Enterprises
Purchase Details
Closed on
Apr 21, 1986
Bought by
Federal Home Loan Mortage
Purchase Details
Closed on
Jan 24, 1984
Sold by
Fishman David
Bought by
Beidelman Mark
Purchase Details
Closed on
Jul 22, 1981
Sold by
Wiener William R and Wiener Linda
Bought by
Fishman David
Purchase Details
Closed on
Jul 17, 1975
Sold by
Thomas Ii Thomas M
Bought by
Wiener William R and Wiener Linda
Purchase Details
Closed on
Jan 1, 1975
Bought by
Thomas Ii Thomas M
Create a Home Valuation Report for This Property
The Home Valuation Report is an in-depth analysis detailing your home's value as well as a comparison with similar homes in the area
Home Values in the Area
Average Home Value in this Area
Purchase History
| Date | Buyer | Sale Price | Title Company |
|---|---|---|---|
| Gorelick Investment Group Iv Llc | $53,000 | Greater Cleveland Title | |
| Horizon Enterprises Llc | -- | Attorney | |
| Horizon Enterprises | $42,000 | -- | |
| Federal Home Loan Mortage | $50,000 | -- | |
| Colonial Mortgage Service Co | -- | -- | |
| Beidelman Mark | $57,500 | -- | |
| Fishman David | $49,000 | -- | |
| Wiener William R | $32,300 | -- | |
| Thomas Ii Thomas M | -- | -- |
Source: Public Records
Tax History
| Year | Tax Paid | Tax Assessment Tax Assessment Total Assessment is a certain percentage of the fair market value that is determined by local assessors to be the total taxable value of land and additions on the property. | Land | Improvement |
|---|---|---|---|---|
| 2024 | $3,770 | $47,600 | $10,010 | $37,590 |
| 2023 | $2,331 | $22,820 | $7,280 | $15,540 |
| 2022 | $2,320 | $22,820 | $7,280 | $15,540 |
| 2021 | $2,304 | $22,820 | $7,280 | $15,540 |
| 2020 | $2,163 | $18,550 | $5,920 | $12,640 |
| 2019 | $3,355 | $95,000 | $16,900 | $78,100 |
| 2018 | $3,339 | $33,250 | $5,920 | $27,340 |
| 2017 | $3,326 | $29,720 | $4,830 | $24,890 |
| 2016 | $3,240 | $29,720 | $4,830 | $24,890 |
| 2015 | $3,298 | $29,720 | $4,830 | $24,890 |
| 2014 | $3,298 | $31,300 | $5,080 | $26,220 |
Source: Public Records
Map
Nearby Homes
- 4201 Lambert Rd
- 4154 Bexley Blvd
- 4229 Hinsdale Rd
- 1606 Laclede Rd
- 1563 Maplegrove Rd
- 1553 Maplegrove Rd
- 1691 S Belvoir Blvd
- 1567 S Belvoir Blvd
- 1508 Maplegrove Rd
- 4041 Wilmington Rd
- 1494 Laclede Rd
- 4157 Verona Rd
- 1895 Temblethurst Rd
- 1539 Sheffield Rd
- 1460 S Belvoir Blvd
- 4482 Shirley Dr
- 4130 Wyncote Rd
- 0 S Belvoir Blvd Unit 5096678
- 1688 Oakwood Dr
- 1376 Avondale Rd
- 4198 Lambert Rd
- 4190 Lambert Rd
- 4202 Lambert Rd
- 4186 Lambert Rd
- 4193 Ellison Rd
- 4189 Ellison Rd
- 4206 Lambert Rd
- 4197 Ellison Rd
- 4182 Lambert Rd
- 4185 Ellison Rd
- 4193 Ellison Rd
- 4201 Ellison Rd
- 4181 Ellison Rd
- 4193 Lambert Rd
- 4210 Lambert Rd
- 4176 Lambert Rd
- 4205 Ellison Rd
- 4197 Lambert Rd
- 4189 Lambert Rd
- 4177 Ellison Rd
Your Personal Tour Guide
Ask me questions while you tour the home.