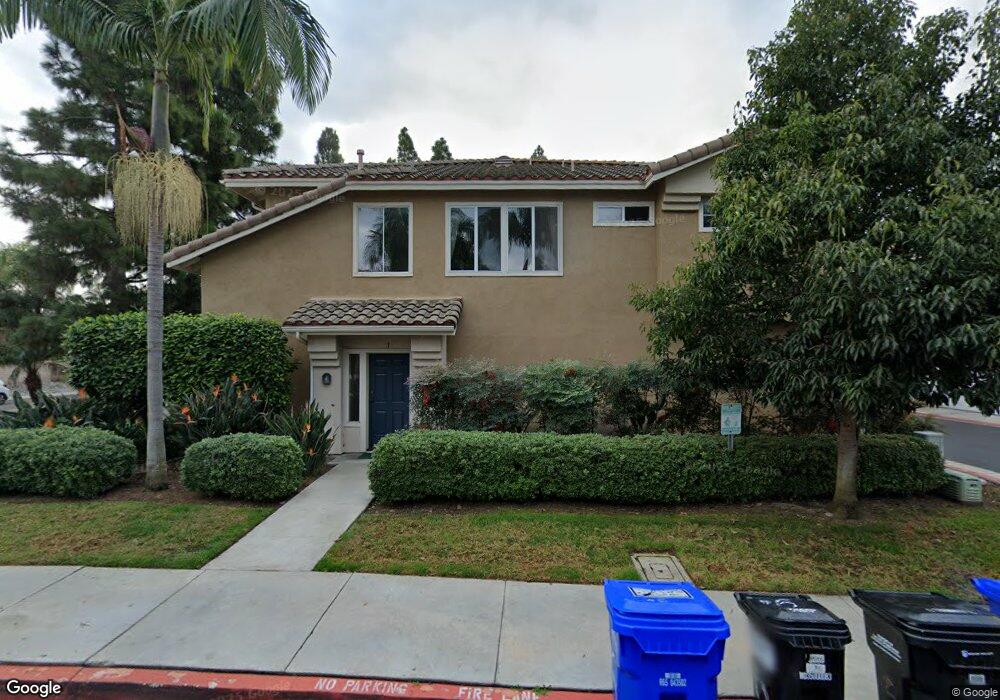
4195 Via Candidiz Unit 2 San Diego, CA 92130
Carmel Valley NeighborhoodEstimated Value: $841,443 - $990,000
2
Beds
2
Baths
976
Sq Ft
$924/Sq Ft
Est. Value
About This Home
This home is located at 4195 Via Candidiz Unit 2, San Diego, CA 92130 and is currently estimated at $901,861, approximately $924 per square foot. 4195 Via Candidiz Unit 2 is a home located in San Diego County with nearby schools including Carmel Creek Elementary School, Solana Pacific Elementary School, and Carmel Valley Middle School.
Ownership History
Date
Name
Owned For
Owner Type
Purchase Details
Closed on
Jan 14, 2015
Sold by
Kim Jennifer G
Bought by
Kim Jennifer Geehyn
Current Estimated Value
Purchase Details
Closed on
Oct 7, 2014
Sold by
Kim Thomas J
Bought by
Kim Jennifer G
Purchase Details
Closed on
Aug 1, 2013
Sold by
Chien Wen Shi and Chien Wentaur
Bought by
Kim Thomas J and Kim Jennifer G
Home Financials for this Owner
Home Financials are based on the most recent Mortgage that was taken out on this home.
Original Mortgage
$207,500
Outstanding Balance
$51,379
Interest Rate
4.28%
Mortgage Type
New Conventional
Estimated Equity
$850,482
Purchase Details
Closed on
Sep 3, 2009
Sold by
Chien Amy L
Bought by
Chien Wen Shi
Home Financials for this Owner
Home Financials are based on the most recent Mortgage that was taken out on this home.
Original Mortgage
$186,000
Interest Rate
5.08%
Mortgage Type
New Conventional
Purchase Details
Closed on
Sep 2, 2009
Sold by
Hsieh Chieh Chen
Bought by
Chien Wentaur
Home Financials for this Owner
Home Financials are based on the most recent Mortgage that was taken out on this home.
Original Mortgage
$186,000
Interest Rate
5.08%
Mortgage Type
New Conventional
Purchase Details
Closed on
Aug 12, 2009
Sold by
Nguyen Bao Ngoc T
Bought by
Chien Wen Shi and Chien Wentaur
Home Financials for this Owner
Home Financials are based on the most recent Mortgage that was taken out on this home.
Original Mortgage
$186,000
Interest Rate
5.08%
Mortgage Type
New Conventional
Purchase Details
Closed on
Apr 5, 2007
Sold by
Nguyen Bao Ngoc T
Bought by
Nguyen Bao Ngoc T
Purchase Details
Closed on
Jun 15, 2005
Sold by
Kollegian Leslie Scott and Kollegian Wendi
Bought by
Nguyen Bao Ngoc T
Home Financials for this Owner
Home Financials are based on the most recent Mortgage that was taken out on this home.
Original Mortgage
$380,000
Interest Rate
6.62%
Mortgage Type
New Conventional
Purchase Details
Closed on
Jan 25, 2001
Sold by
Feffer and Tracy
Bought by
Kollegian Leslie Scott and Kollegian Wendi
Home Financials for this Owner
Home Financials are based on the most recent Mortgage that was taken out on this home.
Original Mortgage
$243,000
Interest Rate
7.12%
Purchase Details
Closed on
Jun 12, 1998
Sold by
Brookfield Palermo Inc
Bought by
Feffer Eric and Feffer Tracy
Home Financials for this Owner
Home Financials are based on the most recent Mortgage that was taken out on this home.
Original Mortgage
$151,905
Interest Rate
6.42%
Create a Home Valuation Report for This Property
The Home Valuation Report is an in-depth analysis detailing your home's value as well as a comparison with similar homes in the area
Home Values in the Area
Average Home Value in this Area
Purchase History
| Date | Buyer | Sale Price | Title Company |
|---|---|---|---|
| Kim Jennifer Geehyn | -- | None Available | |
| Kim Jennifer G | -- | None Available | |
| Kim Thomas J | $415,000 | Fidelity National Title | |
| Chien Wen Shi | -- | Lawyers Title Insurance Corp | |
| Chien Wentaur | -- | Lawyers Title Insurance Corp | |
| Chien Wen Shi | $310,000 | Lawyers Title Insurance Corp | |
| Nguyen Bao Ngoc T | -- | None Available | |
| Nguyen Bao Ngoc T | $475,000 | Equity Title Co San Diego | |
| Kollegian Leslie Scott | $270,000 | First American Title Co | |
| Feffer Eric | $160,000 | Chicago Title Co |
Source: Public Records
Mortgage History
| Date | Status | Borrower | Loan Amount |
|---|---|---|---|
| Open | Kim Thomas J | $207,500 | |
| Previous Owner | Chien Wen Shi | $186,000 | |
| Previous Owner | Nguyen Bao Ngoc T | $380,000 | |
| Previous Owner | Kollegian Leslie Scott | $243,000 | |
| Previous Owner | Feffer Eric | $151,905 |
Source: Public Records
Tax History Compared to Growth
Tax History
| Year | Tax Paid | Tax Assessment Tax Assessment Total Assessment is a certain percentage of the fair market value that is determined by local assessors to be the total taxable value of land and additions on the property. | Land | Improvement |
|---|---|---|---|---|
| 2025 | $6,067 | $508,723 | $295,389 | $213,334 |
| 2024 | $6,067 | $498,749 | $289,598 | $209,151 |
| 2023 | $5,998 | $488,970 | $283,920 | $205,050 |
| 2022 | $5,887 | $479,383 | $278,353 | $201,030 |
| 2021 | $5,797 | $469,985 | $272,896 | $197,089 |
| 2020 | $5,753 | $465,167 | $270,098 | $195,069 |
| 2019 | $5,657 | $456,047 | $264,802 | $191,245 |
| 2018 | $5,563 | $447,106 | $259,610 | $187,496 |
| 2017 | $5,481 | $438,340 | $254,520 | $183,820 |
| 2016 | $5,194 | $429,746 | $249,530 | $180,216 |
| 2015 | $5,127 | $423,291 | $245,782 | $177,509 |
| 2014 | $5,037 | $415,000 | $240,968 | $174,032 |
Source: Public Records
Map
Nearby Homes
- 3965 Via Holgura
- 12936 Carmel Creek Rd Unit 63
- 12370 Carmel Country Rd Unit 202
- 12372 Carmel Country Rd Unit 207
- 12372 Carmel Country Rd Unit 202
- 12364 Carmel Country Rd Unit C306
- 12368 Carmel Country Rd Unit 303
- 12620 Carmel Country Rd Unit 74
- 3718 Mykonos Ln Unit 158
- 4271 Corte Favor
- 4436 Heritage Glen Ln
- 3857 Pell Place Unit 406
- 12550 Carmel Creek Rd Unit 100
- 4049 Carmel View Rd Unit 74
- 4049 Carmel View Rd Unit 75
- 12585 Ruette Alliante Unit 152
- 3856 Quarter Mile Dr
- 12540 Caminito Mira Del Mar
- 12518 Cavallo St
- 3606 Bernwood Place Unit 14
- 4195 Via Candidiz Unit 6
- 4195 Via Candidiz Unit 5
- 4195 Via Candidiz Unit 4
- 4195 Via Candidiz Unit 3
- 4195 Via Candidiz Unit 1
- 4175 Via Candidiz Unit 21
- 4175 Via Candidiz Unit 20
- 4175 Via Candidiz Unit 19
- 4175 Via Candidiz Unit 18
- 4175 Via Candidiz Unit 17
- 4175 Via Candidiz Unit 16
- 4175 Via Candidiz Unit 15
- 4175 Via Candidiz Unit 14
- 4175 Via Candidiz Unit 13
- 12828 Calle de la Siena
- 12791 Via Terceto
- 3980 Via Holgura
- 12787 Via Terceto
- 12789 Via Terceto Unit 30
- 12793 Via Terceto