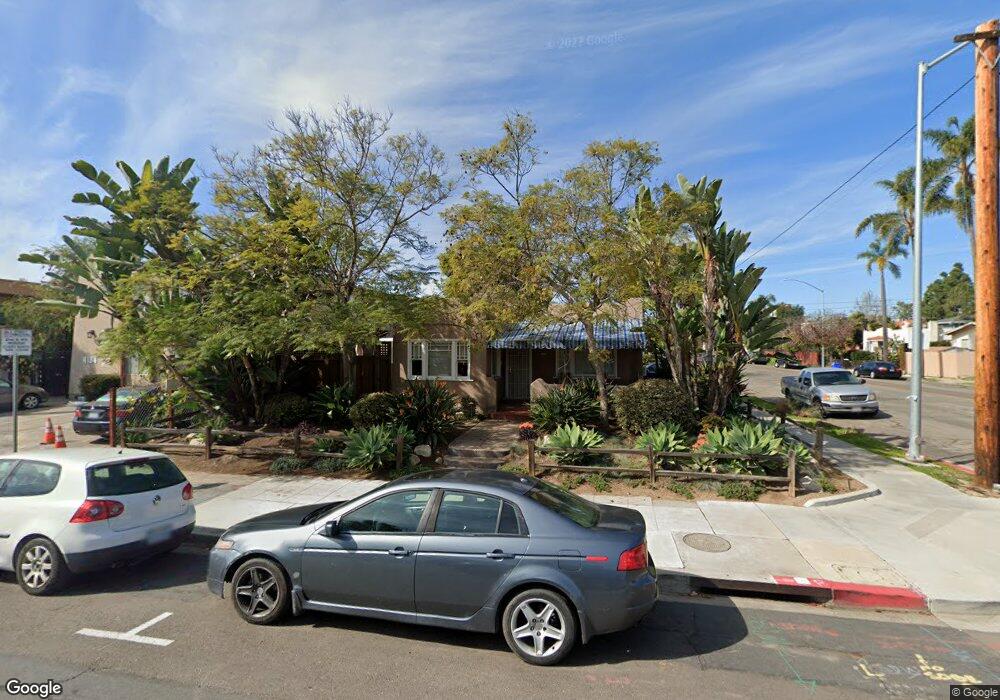
4196 Iowa St San Diego, CA 92104
North Park NeighborhoodEstimated Value: $844,000 - $958,000
2
Beds
1
Bath
912
Sq Ft
$1,006/Sq Ft
Est. Value
About This Home
This home is located at 4196 Iowa St, San Diego, CA 92104 and is currently estimated at $917,122, approximately $1,005 per square foot. 4196 Iowa St is a home located in San Diego County with nearby schools including Garfield Elementary, Roosevelt International Middle School, and North Park Christian School.
Ownership History
Date
Name
Owned For
Owner Type
Purchase Details
Closed on
Dec 5, 2011
Sold by
West John D
Bought by
Steacy Stephen David
Current Estimated Value
Home Financials for this Owner
Home Financials are based on the most recent Mortgage that was taken out on this home.
Original Mortgage
$300,000
Outstanding Balance
$204,529
Interest Rate
3.94%
Mortgage Type
New Conventional
Estimated Equity
$712,593
Purchase Details
Closed on
Jun 2, 1997
Sold by
Secretary Of Veterans Affairs
Bought by
West John D
Home Financials for this Owner
Home Financials are based on the most recent Mortgage that was taken out on this home.
Original Mortgage
$66,250
Interest Rate
8.08%
Mortgage Type
Seller Take Back
Purchase Details
Closed on
Dec 8, 1995
Sold by
Bancboston Mtg Corp
Bought by
Va
Purchase Details
Closed on
Dec 6, 1995
Sold by
Maurer Andrew J
Bought by
Bancboston Mtg Corp
Purchase Details
Closed on
Aug 15, 1989
Purchase Details
Closed on
Dec 1, 1987
Purchase Details
Closed on
Oct 19, 1987
Purchase Details
Closed on
Jan 27, 1984
Create a Home Valuation Report for This Property
The Home Valuation Report is an in-depth analysis detailing your home's value as well as a comparison with similar homes in the area
Home Values in the Area
Average Home Value in this Area
Purchase History
| Date | Buyer | Sale Price | Title Company |
|---|---|---|---|
| Steacy Stephen David | $375,000 | First American Title Insuran | |
| West John D | -- | Lawyers Title | |
| Va | $145,619 | First Southwestern Title Co | |
| Bancboston Mtg Corp | $109,515 | First Southwestern Title Co | |
| -- | $131,000 | -- | |
| -- | $92,000 | -- | |
| -- | $87,000 | -- | |
| -- | $73,000 | -- |
Source: Public Records
Mortgage History
| Date | Status | Borrower | Loan Amount |
|---|---|---|---|
| Open | Steacy Stephen David | $300,000 | |
| Previous Owner | West John D | $66,250 |
Source: Public Records
Tax History Compared to Growth
Tax History
| Year | Tax Paid | Tax Assessment Tax Assessment Total Assessment is a certain percentage of the fair market value that is determined by local assessors to be the total taxable value of land and additions on the property. | Land | Improvement |
|---|---|---|---|---|
| 2025 | $5,652 | $471,008 | $301,446 | $169,562 |
| 2024 | $5,652 | $461,774 | $295,536 | $166,238 |
| 2023 | $5,525 | $452,721 | $289,742 | $162,979 |
| 2022 | $5,375 | $443,845 | $284,061 | $159,784 |
| 2021 | $5,335 | $435,143 | $278,492 | $156,651 |
| 2020 | $5,270 | $430,682 | $275,637 | $155,045 |
| 2019 | $5,174 | $422,238 | $270,233 | $152,005 |
| 2018 | $4,837 | $413,960 | $264,935 | $149,025 |
| 2017 | $80 | $405,844 | $259,741 | $146,103 |
| 2016 | $4,643 | $397,888 | $254,649 | $143,239 |
| 2015 | $4,574 | $391,912 | $250,824 | $141,088 |
| 2014 | $4,501 | $384,236 | $245,911 | $138,325 |
Source: Public Records
Map
Nearby Homes
- 4205 Ohio St Unit 204
- 4205 Ohio St Unit 106
- 4030 Ohio St
- 3245 Bramson Place
- 4051-53 32nd St
- 4074 30th St
- 4119-23 Kansas
- 4347 30th St Unit 53
- 4366 Ohio St
- 4170 33rd St Unit 204
- 4153-55 Utah St
- 4121 Utah St
- 3950 Ohio St Unit 507
- 3939 Illinois St Unit 1C
- 3957 30th St Unit 319
- 4043 Utah St Unit 8
- 4043 Utah St Unit 3
- 4226 Utah St
- 4449-55 Illinois St
- 3320 Orange Ave
- 3129 Howard Ave
- 4174 Iowa St
- 4204 Iowa St
- 3119 Howard Ave
- 4168 Iowa St
- 3126 Howard Ave Unit 32
- 3163 Howard Ave Unit 67
- 4212 Iowa St
- 4185 Iowa St
- 3120 Howard Ave
- 4158 Iowa St Unit 64
- 4207 Iowa St
- 4177 Iowa St
- 4193 Illinois St
- 4177 Illinois St Unit 2,
- 4177 Illinois St
- 4185 Illinois St
- 4167 Iowa St
- 4218 Iowa St
- 4218-28 Iowa St