M
Landlord's Agent in 2022
Michael Cain
RE/MAX
(812) 228-5488
1 in this area
7 Total Sales


Estimated Value: $238,037 - $258,000
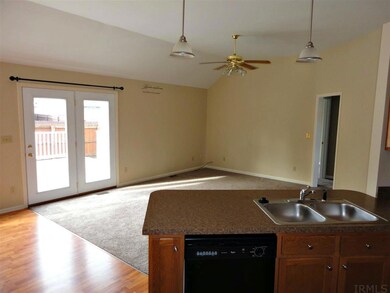
Lovely, clean and fresh home in a very convenient Newburgh location. Nice split bedroom floor plan, spacious sunny great room, kitchen has nice black appliances. Master bedroom suite has huge walk in closet. Fenced back yard with large deck and yard barn for extra storage. The tenant is responsible for all utilities. One year lease with matching deposit. Credit, background and rental check required. No smoking and no pets. Schools: John H. Castle, Castle North, and Castle Average CenterPoint $205
| Date | Buyer | Sale Price | Title Company |
|---|---|---|---|
| Huang Beirong | $135,000 | -- | |
| Sims Beverly A | -- | None Available |
| Date | Event | Price | List to Sale | Price per Sq Ft | Prior Sale |
|---|---|---|---|---|---|
| 11/15/2022 11/15/22 | Rented | $1,495 | 0.0% | -- | |
| 11/03/2022 11/03/22 | Under Contract | -- | -- | -- | |
| 10/15/2022 10/15/22 | For Rent | $1,495 | +15.4% | -- | |
| 10/10/2019 10/10/19 | Rented | $1,295 | 0.0% | -- | |
| 10/09/2019 10/09/19 | Under Contract | -- | -- | -- | |
| 09/10/2019 09/10/19 | Price Changed | $1,295 | -7.2% | $1 / Sq Ft | |
| 08/02/2019 08/02/19 | For Rent | $1,395 | 0.0% | -- | |
| 03/15/2019 03/15/19 | Rented | $1,395 | 0.0% | -- | |
| 03/13/2019 03/13/19 | Under Contract | -- | -- | -- | |
| 01/07/2019 01/07/19 | Price Changed | $1,395 | -2.1% | $1 / Sq Ft | |
| 12/27/2018 12/27/18 | For Rent | $1,425 | -13.0% | -- | |
| 02/01/2018 02/01/18 | Rented | $1,638 | +14.9% | -- | |
| 01/31/2018 01/31/18 | Under Contract | -- | -- | -- | |
| 12/11/2017 12/11/17 | For Rent | $1,425 | +1.8% | -- | |
| 08/19/2016 08/19/16 | Rented | $1,400 | 0.0% | -- | |
| 07/28/2016 07/28/16 | Under Contract | -- | -- | -- | |
| 07/01/2016 07/01/16 | For Rent | $1,400 | -99.0% | -- | |
| 02/04/2016 02/04/16 | Under Contract | -- | -- | -- | |
| 01/15/2016 01/15/16 | Sold | $135,000 | 0.0% | $96 / Sq Ft | View Prior Sale |
| 01/15/2016 01/15/16 | For Rent | $1,425 | -13.1% | -- | |
| 01/15/2016 01/15/16 | Rented | $1,640 | 0.0% | -- | |
| 12/17/2015 12/17/15 | Pending | -- | -- | -- | |
| 11/19/2015 11/19/15 | For Sale | $142,000 | -- | $101 / Sq Ft |
| Year | Tax Paid | Tax Assessment Tax Assessment Total Assessment is a certain percentage of the fair market value that is determined by local assessors to be the total taxable value of land and additions on the property. | Land | Improvement |
|---|---|---|---|---|
| 2024 | $2,697 | $186,200 | $15,500 | $170,700 |
| 2023 | $2,766 | $185,900 | $20,100 | $165,800 |
| 2022 | $2,534 | $173,700 | $20,100 | $153,600 |
| 2021 | $2,262 | $143,700 | $18,600 | $125,100 |
| 2020 | $2,213 | $133,100 | $16,800 | $116,300 |
| 2019 | $2,170 | $127,300 | $16,800 | $110,500 |
| 2018 | $1,992 | $121,800 | $16,800 | $105,000 |
| 2017 | $1,958 | $120,400 | $16,800 | $103,600 |
| 2016 | $1,925 | $119,000 | $16,800 | $102,200 |
| 2014 | $1,813 | $119,000 | $18,400 | $100,600 |
| 2013 | $1,759 | $118,100 | $18,400 | $99,700 |
M
Landlord's Agent in 2022
Michael Cain
RE/MAX
(812) 228-5488
1 in this area
7 Total Sales
J
Seller's Agent in 2016
Jim Fuquay
HOUSE HUNTER REALTY BNM GROUP LLC

Buyer's Agent in 2016
Julie Bosma
ERA FIRST ADVANTAGE REALTY, INC
(812) 457-6968
94 in this area
289 Total Sales
Source: Indiana Regional MLS
MLS Number: 202243010
APN: 87-12-28-103-035.000-019
Disclaimer: Certain information contained herein is derived from information provided by parties other than Homes.com. All information provided is deemed reliable, but is not guaranteed to be accurate and should be independently verified.
![]() IDX information is provided exclusively for personal, non-commercial use, and may not be used for any purpose other than to identify prospective properties consumers may be interested in purchasing. Information is deemed reliable but not guaranteed.
IDX information is provided exclusively for personal, non-commercial use, and may not be used for any purpose other than to identify prospective properties consumers may be interested in purchasing. Information is deemed reliable but not guaranteed.