Estimated Value: $492,000 - $568,781
4
Beds
3
Baths
2,064
Sq Ft
$252/Sq Ft
Est. Value
About This Home
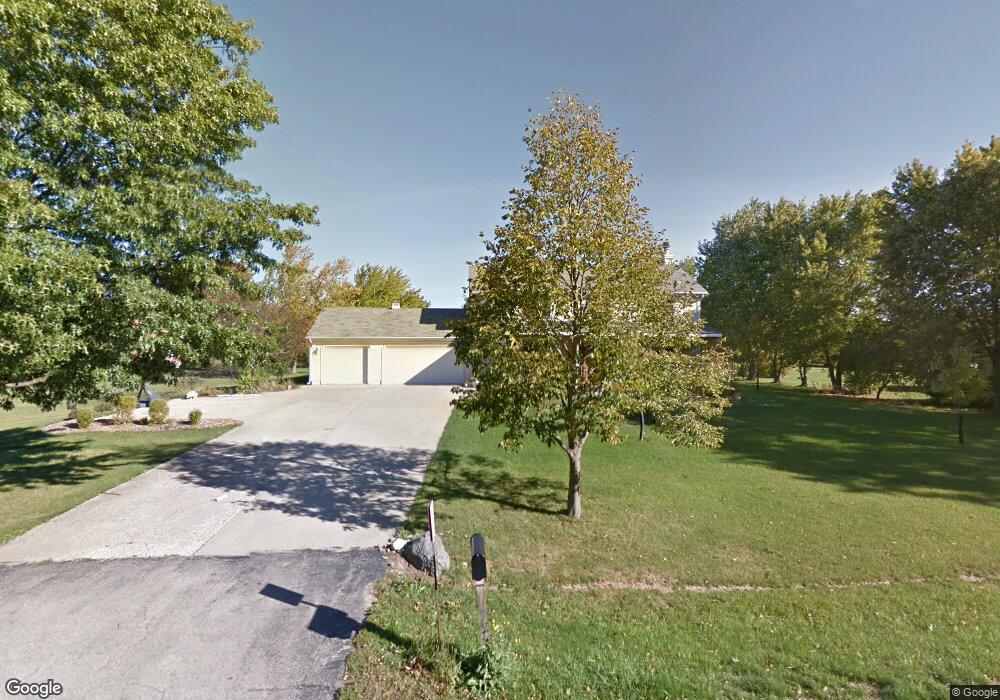
This home is located at 41W580 Lenz Rd, Elgin, IL 60124 and is currently estimated at $519,695, approximately $251 per square foot. 41W580 Lenz Rd is a home located in Kane County with nearby schools including Lily Lake Grade School, Prairie Knolls Middle School, and Central Middle School.
Ownership History
Date
Name
Owned For
Owner Type
Purchase Details
Closed on
May 26, 2017
Sold by
Anderson Edward C and Anderson Jennifer L
Bought by
Anderson Edward C and Anderson Jejennifer L
Current Estimated Value
Purchase Details
Closed on
Aug 27, 2004
Sold by
Angvick Steven K and Angvick Debra J
Bought by
Anderson Edward C and Anderson Jennifer L
Home Financials for this Owner
Home Financials are based on the most recent Mortgage that was taken out on this home.
Original Mortgage
$167,000
Outstanding Balance
$84,332
Interest Rate
6.17%
Mortgage Type
Purchase Money Mortgage
Estimated Equity
$435,363
Purchase Details
Closed on
Jun 13, 2000
Sold by
Rice Raymond L and Rice Malory
Bought by
Angvick Steven K and Angvick Debra J
Home Financials for this Owner
Home Financials are based on the most recent Mortgage that was taken out on this home.
Original Mortgage
$151,500
Interest Rate
8.31%
Create a Home Valuation Report for This Property
The Home Valuation Report is an in-depth analysis detailing your home's value as well as a comparison with similar homes in the area
Home Values in the Area
Average Home Value in this Area
Purchase History
| Date | Buyer | Sale Price | Title Company |
|---|---|---|---|
| Anderson Edward C | -- | None Available | |
| Anderson Edward C | $312,000 | Premier Title | |
| Angvick Steven K | $252,000 | Greater Illinois Title Compa |
Source: Public Records
Mortgage History
| Date | Status | Borrower | Loan Amount |
|---|---|---|---|
| Open | Anderson Edward C | $167,000 | |
| Previous Owner | Angvick Steven K | $151,500 |
Source: Public Records
Tax History Compared to Growth
Tax History
| Year | Tax Paid | Tax Assessment Tax Assessment Total Assessment is a certain percentage of the fair market value that is determined by local assessors to be the total taxable value of land and additions on the property. | Land | Improvement |
|---|---|---|---|---|
| 2024 | $10,452 | $169,024 | $27,638 | $141,386 |
| 2023 | $9,852 | $152,893 | $25,000 | $127,893 |
| 2022 | $10,010 | $149,043 | $23,138 | $125,905 |
| 2021 | $9,347 | $138,197 | $22,353 | $115,844 |
| 2020 | $8,691 | $104,144 | $21,951 | $82,193 |
| 2019 | $8,686 | $102,797 | $21,667 | $81,130 |
| 2018 | $7,357 | $88,443 | $20,665 | $67,778 |
| 2017 | $7,159 | $85,312 | $20,141 | $65,171 |
| 2016 | $7,465 | $83,288 | $19,663 | $63,625 |
| 2015 | -- | $79,015 | $19,663 | $59,352 |
| 2014 | -- | $77,440 | $19,663 | $57,777 |
| 2013 | -- | $80,270 | $19,999 | $60,271 |
Source: Public Records
Map
Nearby Homes
- 41W591 Lenz Rd
- 1853 Chandolin Ln
- 1831 Chandolin Ln
- 1855 Chandolin Ln
- 4378 John Milton Rd
- 41W072 Bowes Rd
- 40W513 Old Mill Ct
- 3689 Thornhill Dr
- 40W156 Sturbridge Way
- 3660 Thornhill Dr
- 9N954 Heatherington Place
- 3646 Thornhill Dr
- 3584 Tournament Dr
- 10N874 Rippburger Rd
- 3870 Crooked Creek Dr
- 41W455 Brierwood Dr
- 10N701 Prairie Crossing
- Newcastle Plan at Ponds of Stony Creek - Phase II
- at Ponds of Stony Creek - Phase II
- Windsor Plan at Ponds of Stony Creek - Phase II
- 41W550 Lenz Rd
- 41W573 Lenz Rd
- 41W655 Silvana Dr
- 41W635 Silvana Dr Unit 2
- 41W520 Lenz Rd
- 41W595 Silvana Dr Unit 2
- 41W555 Silvana Dr Unit 2
- 41W651 Lenz Rd
- 41W496 Lenz Rd
- 41W535 Silvana Dr
- 41W501 Lenz Rd
- 41W670 Silvana Dr Unit 2
- 41W650 Silvana Dr
- 41W630 Silvana Dr
- 41W501 Silvana Dr
- 41W610 Silvana Dr
- 41W590 Silvana Dr
- 41W700 Lenz Rd
- 41W570 Silvana Dr Unit 2
- 41W475 Silvana Dr Unit 2