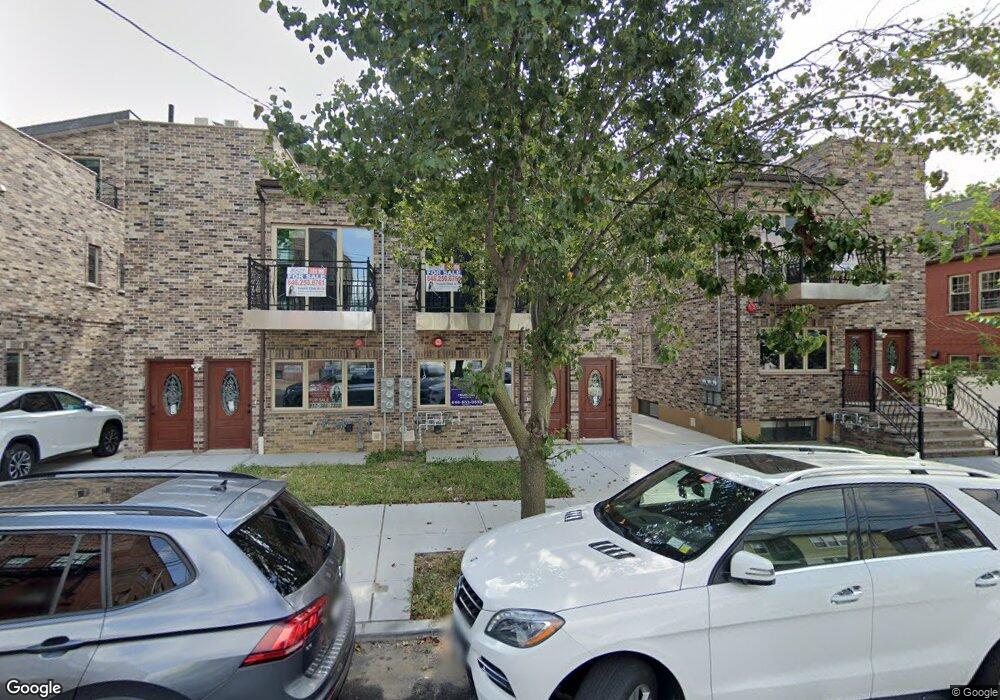
42-21 165th St Unit 2&3 Flushing, NY 11358
Flushing NeighborhoodEstimated Value: $1,728,998 - $2,002,000
5
Beds
4
Baths
2,000
Sq Ft
$914/Sq Ft
Est. Value
About This Home
This home is located at 42-21 165th St Unit 2&3, Flushing, NY 11358 and is currently estimated at $1,828,750, approximately $914 per square foot. 42-21 165th St Unit 2&3 is a home located in Queens County with nearby schools including I.S. 25 Adrien Block, Francis Lewis High School, and St. Andrew Avellino Catholic Academy.
Ownership History
Date
Name
Owned For
Owner Type
Purchase Details
Closed on
Feb 21, 2023
Sold by
Cf Sanford Company Llc
Bought by
Jssn1688 Llc
Current Estimated Value
Home Financials for this Owner
Home Financials are based on the most recent Mortgage that was taken out on this home.
Original Mortgage
$700,000
Outstanding Balance
$676,493
Interest Rate
6.33%
Mortgage Type
Purchase Money Mortgage
Estimated Equity
$1,152,257
Purchase Details
Closed on
Mar 22, 2022
Sold by
Cf Sanford Company Llc
Bought by
Cf Sanford Company Llc
Purchase Details
Closed on
Jun 25, 2019
Sold by
165N Llc and Apex Usa Development Llc
Bought by
Cf Sanford Company Llc
Purchase Details
Closed on
Dec 8, 2017
Sold by
Evangelical English Lutheran Church Of T
Bought by
Ae & Ly Realty Llc and Apex Usa Development Llc
Create a Home Valuation Report for This Property
The Home Valuation Report is an in-depth analysis detailing your home's value as well as a comparison with similar homes in the area
Home Values in the Area
Average Home Value in this Area
Purchase History
| Date | Buyer | Sale Price | Title Company |
|---|---|---|---|
| Jssn1688 Llc | $1,425,550 | -- | |
| Jssn1688 Llc | $1,425,550 | -- | |
| Jssn1688 Llc | $1,425,550 | -- | |
| Cf Sanford Company Llc | -- | -- | |
| Cf Sanford Company Llc | -- | -- | |
| Cf Sanford Company Llc | -- | -- | |
| Cf Sanford Company Llc | $9,200,000 | -- | |
| Cf Sanford Company Llc | $9,200,000 | -- | |
| Ae & Ly Realty Llc | $7,500,000 | -- | |
| 165N Llc | -- | -- | |
| Ae & Ly Realty Llc | $7,500,000 | -- |
Source: Public Records
Mortgage History
| Date | Status | Borrower | Loan Amount |
|---|---|---|---|
| Open | Jssn1688 Llc | $700,000 | |
| Closed | Jssn1688 Llc | $700,000 |
Source: Public Records
Tax History Compared to Growth
Tax History
| Year | Tax Paid | Tax Assessment Tax Assessment Total Assessment is a certain percentage of the fair market value that is determined by local assessors to be the total taxable value of land and additions on the property. | Land | Improvement |
|---|---|---|---|---|
| 2025 | $14,895 | $74,158 | $18,935 | $55,223 |
| 2024 | $14,895 | $74,158 | $21,729 | $52,429 |
| 2023 | $14,688 | $73,130 | $14,946 | $58,184 |
| 2022 | $2,815 | $14,100 | $12,704 | $1,396 |
| 2021 | $2,802 | $13,312 | $12,704 | $608 |
| 2020 | $22,197 | $118,193 | $114,540 | $3,653 |
| 2019 | $20,835 | $99,600 | $99,600 | $0 |
| 2018 | $107,486 | $1,022,310 | $747,000 | $275,310 |
| 2017 | $0 | $969,030 | $752,130 | $216,900 |
| 2016 | -- | $969,030 | $752,130 | $216,900 |
| 2015 | -- | $899,820 | $762,390 | $137,430 |
| 2014 | -- | $876,780 | $762,390 | $114,390 |
Source: Public Records
Map
Nearby Homes
- 42-6 164th St
- 43-15 164th St
- 43-33 163rd St
- 43-24 163rd St
- 4116 169th St
- 43-7 162nd St
- 42-16 162nd St
- 43-04 169th St
- 43-56 168th St
- 43-52 169th St
- 163-02 45th Ave
- 16003 Sanford Ave
- 167-10 Crocheron Ave Unit 1F
- 3641 169th St Unit 2F
- 16001 Sanford Ave
- 4344 161st St
- 35-91 161st St Unit 2B
- 35-91 161st St Unit 6J
- 45-35 163rd St
- 35-63 168th St
- 4215 165th St
- 16502 Sanford Ave Unit C9
- 16502 Sanford Ave Unit 302
- 16502 Sanford Ave Unit 301
- 165-02 Sanford Ave Unit B2
- 165-02 Sanford Ave Unit B1
- 165-02 Sanford Ave Unit A2
- 165-02 Sanford Ave Unit A1
- 165-02 Sanford Ave Unit 208
- 165-02 Sanford Ave Unit 207
- 165-02 Sanford Ave Unit 205
- 165-02 Sanford Ave Unit 206
- 165-02 Sanford Ave Unit 204
- 165-02 Sanford Ave Unit 203
- 165-02 Sanford Ave Unit 202
- 165-02 Sanford Ave Unit 210
- 165-02 Sanford Ave Unit 209
- 165-02 Sanford Ave Unit 201
- 42-23 165th St Unit 2FL
- 42-23 165th St Unit 1FL