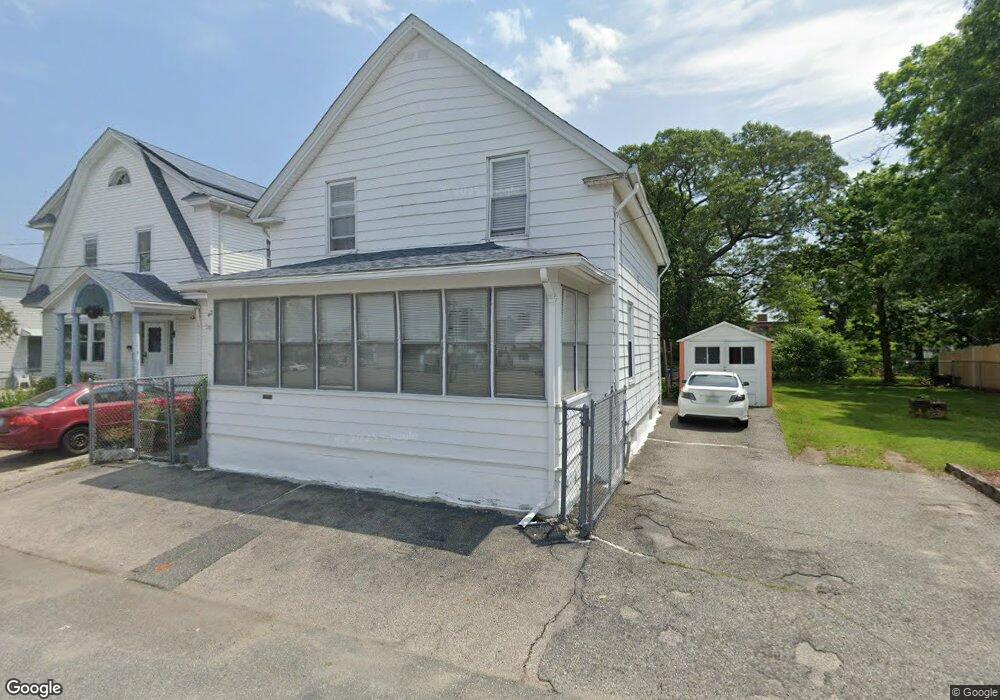
42 3rd Ave Cranston, RI 02910
Park View NeighborhoodEstimated Value: $361,875 - $391,000
4
Beds
2
Baths
1,075
Sq Ft
$349/Sq Ft
Est. Value
About This Home
This home is located at 42 3rd Ave, Cranston, RI 02910 and is currently estimated at $374,719, approximately $348 per square foot. 42 3rd Ave is a home located in Providence County with nearby schools including Edgewood Highland Elementary School, Edward S. Rhodes School, and Park View Middle School.
Ownership History
Date
Name
Owned For
Owner Type
Purchase Details
Closed on
Feb 4, 2008
Sold by
Timotio Delvina S
Bought by
Duran Isaura and Duran Joseph
Current Estimated Value
Home Financials for this Owner
Home Financials are based on the most recent Mortgage that was taken out on this home.
Original Mortgage
$156,750
Outstanding Balance
$98,599
Interest Rate
6.18%
Mortgage Type
Purchase Money Mortgage
Estimated Equity
$276,120
Create a Home Valuation Report for This Property
The Home Valuation Report is an in-depth analysis detailing your home's value as well as a comparison with similar homes in the area
Home Values in the Area
Average Home Value in this Area
Purchase History
| Date | Buyer | Sale Price | Title Company |
|---|---|---|---|
| Duran Isaura | $165,000 | -- |
Source: Public Records
Mortgage History
| Date | Status | Borrower | Loan Amount |
|---|---|---|---|
| Open | Duran Isaura | $156,750 | |
| Previous Owner | Duran Isaura | $50,000 |
Source: Public Records
Tax History
| Year | Tax Paid | Tax Assessment Tax Assessment Total Assessment is a certain percentage of the fair market value that is determined by local assessors to be the total taxable value of land and additions on the property. | Land | Improvement |
|---|---|---|---|---|
| 2025 | $3,562 | $256,600 | $84,900 | $171,700 |
| 2024 | $3,492 | $256,600 | $84,900 | $171,700 |
| 2023 | $3,444 | $182,200 | $58,600 | $123,600 |
| 2022 | $3,367 | $181,900 | $58,600 | $123,300 |
| 2021 | $3,274 | $181,900 | $58,600 | $123,300 |
| 2020 | $2,989 | $143,900 | $45,500 | $98,400 |
| 2019 | $2,989 | $143,900 | $45,500 | $98,400 |
| 2018 | $2,920 | $143,900 | $45,500 | $98,400 |
| 2017 | $2,760 | $120,300 | $35,800 | $84,500 |
| 2016 | $2,701 | $120,300 | $35,800 | $84,500 |
Source: Public Records
Map
Nearby Homes
- 12 3rd Ave Unit 1, 2, 3
- 34 3rd Ave
- 38 Goeckel Ave
- 46 3rd Ave
- 5 3rd Ave
- 1621 Elmwood Ave
- 1625 Elmwood Ave
- 15 4th Ave
- 0 4th Ave
- 1637 Elmwood Ave
- 9 4th Ave
- 1627 Elmwood Ave
- 1629 Elmwood Ave
- 1629 Elmwood Ave Unit 2
- 1612 Elmwood Ave
- 38 2nd Ave
- 1624 Elmwood Ave
- 1600 Elmwood Ave
- 1591 Elmwood Ave
- 35 1st Ave
Your Personal Tour Guide
Ask me questions while you tour the home.