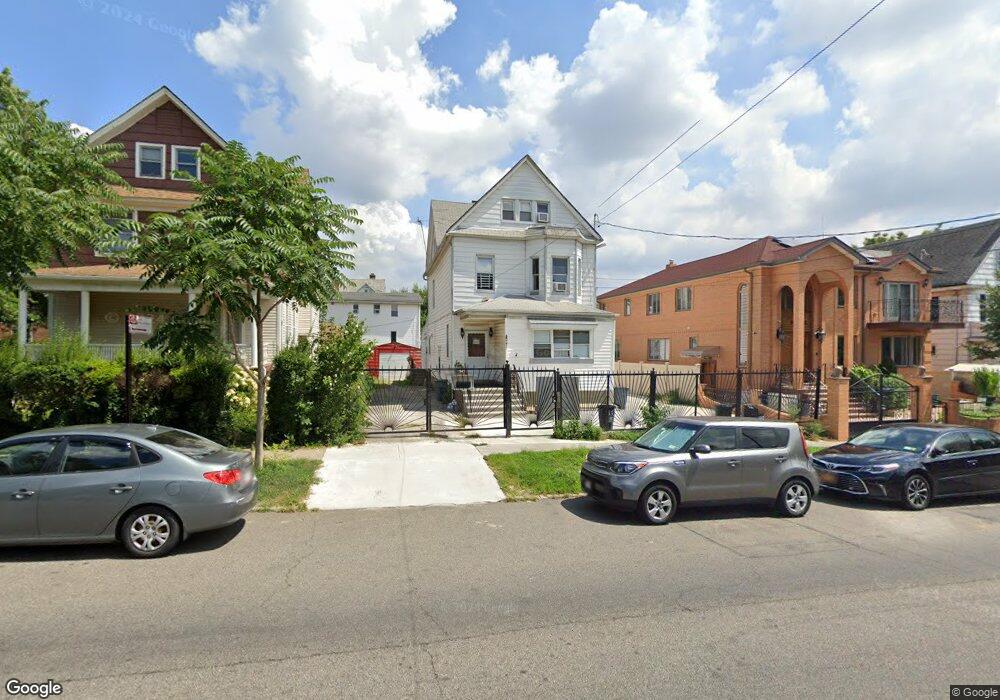
42-69 149th St Flushing, NY 11355
Flushing NeighborhoodEstimated Value: $1,468,619 - $1,732,000
7
Beds
5
Baths
2,359
Sq Ft
$685/Sq Ft
Est. Value
About This Home
This home is located at 42-69 149th St, Flushing, NY 11355 and is currently estimated at $1,614,905, approximately $684 per square foot. 42-69 149th St is a home located in Queens County with nearby schools including P.S. 22 - Thomas Jefferson, J.H.S. 189Q Daniel Carter Beard, and Flushing High School.
Ownership History
Date
Name
Owned For
Owner Type
Purchase Details
Closed on
Nov 16, 2015
Sold by
Rincon Ana Norma and Rincon Hernando
Bought by
Cho Yuk and Zhou Qiao Ying
Current Estimated Value
Home Financials for this Owner
Home Financials are based on the most recent Mortgage that was taken out on this home.
Original Mortgage
$767,000
Outstanding Balance
$604,917
Interest Rate
3.87%
Estimated Equity
$1,009,988
Purchase Details
Closed on
Nov 9, 2001
Sold by
Ruiz Gilma
Bought by
Rincon Hernando and Rincon Norma
Home Financials for this Owner
Home Financials are based on the most recent Mortgage that was taken out on this home.
Original Mortgage
$367,200
Interest Rate
6.81%
Purchase Details
Closed on
Nov 18, 1998
Sold by
Cannavina Danny and Cannavina Ada
Bought by
Ruiz Gilma
Home Financials for this Owner
Home Financials are based on the most recent Mortgage that was taken out on this home.
Original Mortgage
$270,000
Interest Rate
11%
Create a Home Valuation Report for This Property
The Home Valuation Report is an in-depth analysis detailing your home's value as well as a comparison with similar homes in the area
Home Values in the Area
Average Home Value in this Area
Purchase History
| Date | Buyer | Sale Price | Title Company |
|---|---|---|---|
| Cho Yuk | $1,285,000 | -- | |
| Rincon Hernando | -- | -- | |
| Ruiz Gilma | $300,000 | First American Title Ins Co |
Source: Public Records
Mortgage History
| Date | Status | Borrower | Loan Amount |
|---|---|---|---|
| Open | Cho Yuk | $767,000 | |
| Previous Owner | Rincon Hernando | $367,200 | |
| Previous Owner | Ruiz Gilma | $270,000 |
Source: Public Records
Tax History Compared to Growth
Tax History
| Year | Tax Paid | Tax Assessment Tax Assessment Total Assessment is a certain percentage of the fair market value that is determined by local assessors to be the total taxable value of land and additions on the property. | Land | Improvement |
|---|---|---|---|---|
| 2025 | $10,395 | $54,859 | $13,761 | $41,098 |
| 2024 | $10,395 | $51,756 | $13,901 | $37,855 |
| 2023 | $10,128 | $50,426 | $12,683 | $37,743 |
| 2022 | $9,497 | $86,220 | $22,320 | $63,900 |
| 2021 | $10,012 | $74,760 | $22,320 | $52,440 |
| 2020 | $9,677 | $78,120 | $22,320 | $55,800 |
| 2019 | $9,022 | $80,700 | $22,320 | $58,380 |
| 2018 | $8,566 | $42,022 | $11,402 | $30,620 |
| 2017 | $8,082 | $39,645 | $14,748 | $24,897 |
| 2016 | $7,616 | $39,645 | $14,748 | $24,897 |
| 2015 | $4,291 | $38,097 | $18,338 | $19,759 |
| 2014 | $4,291 | $35,942 | $17,841 | $18,101 |
Source: Public Records
Map
Nearby Homes
- 14936 Ash Ave
- 149-36 Ash Ave
- 149-18 Cherry Ave
- 149-51 Ash Ave
- 4307 149th St
- 149-63 Ash Ave
- 14917 Sanford Ave Unit 4A
- 41-50 149th Place Unit C2F
- 154-21 Ash Ave
- 14716 Cherry Ave
- 42-26 147th St Unit 5B
- 147-30 Barclay Ave Unit 3B
- 42-18 147th St Unit 4A
- 150-23 Barclay Ave Unit 3H
- 150-23 Barclay Ave Unit 5A
- 150-23 Barclay Ave Unit 4H
- 41-22 149th St
- 4218 147th St Unit 2E
- 4218 147th St Unit 3J
- 42-36 156th St
- 42-73 149th St
- 4269 149th St
- 4273 149th St
- 149-06 Beech Ave
- 14906 Beech Ave
- 14905 Cherry Ave
- 149-11 Cherry Ave
- 149-14 Beech Ave
- 14914 Beech Ave
- 14911 Cherry Ave
- 4276 149th St Unit 2nd Fl
- 4276 149th St Unit 3rd Fl
- 4276 149th St Unit 1 Fl
- 42-76 149th St
- 42-76 149th St Unit 2nd Fl
- 42-76 149th St Unit 3rd Fl
- 42-76 149th St Unit 1 Fl
- 4276 149th St
- 42-76 149th St Unit 2Fl
- 4274 149th St