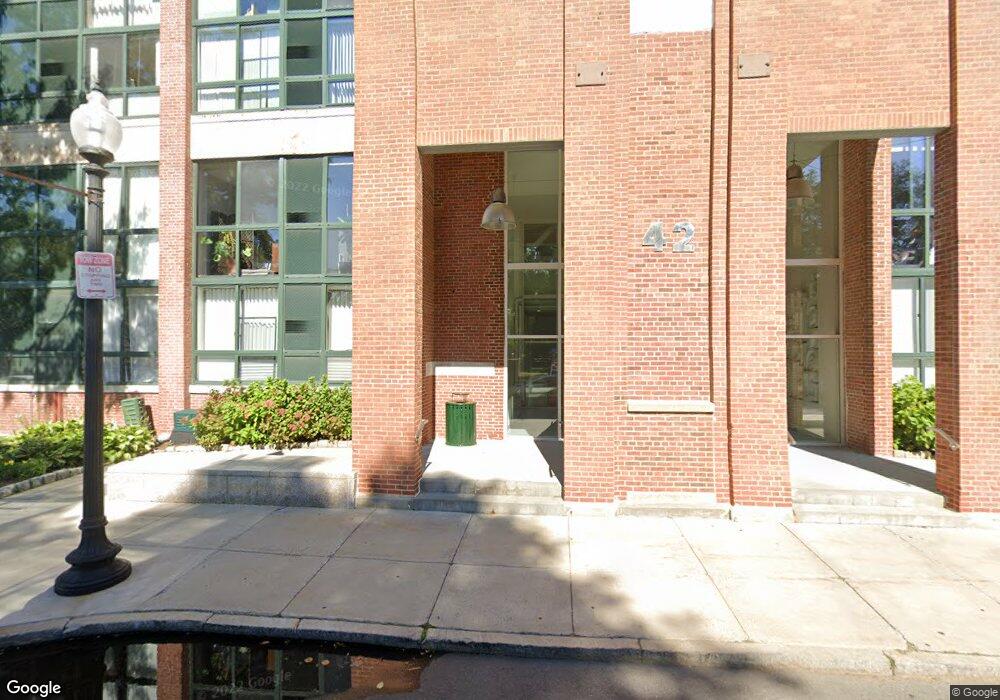
Parris Landing 42 8th St Unit 1403 Boston, MA 02129
Thompson Square-Bunker Hill NeighborhoodEstimated Value: $554,889 - $610,000
1
Bed
1
Bath
682
Sq Ft
$839/Sq Ft
Est. Value
About This Home
This home is located at 42 8th St Unit 1403, Boston, MA 02129 and is currently estimated at $572,472, approximately $839 per square foot. 42 8th St Unit 1403 is a home located in Suffolk County with nearby schools including Boston Children's School and St John School.
Ownership History
Date
Name
Owned For
Owner Type
Purchase Details
Closed on
Jun 4, 2019
Sold by
Fournier Ryan and Ceniseroz Zoila
Bought by
Zhao Jinmo
Current Estimated Value
Home Financials for this Owner
Home Financials are based on the most recent Mortgage that was taken out on this home.
Original Mortgage
$300,000
Outstanding Balance
$263,773
Interest Rate
4.1%
Mortgage Type
New Conventional
Estimated Equity
$308,699
Purchase Details
Closed on
Mar 30, 2017
Sold by
Ousey Molly M
Bought by
Fournier Ryan and Ceniseroz Zoila
Home Financials for this Owner
Home Financials are based on the most recent Mortgage that was taken out on this home.
Original Mortgage
$413,100
Interest Rate
3.75%
Mortgage Type
Adjustable Rate Mortgage/ARM
Purchase Details
Closed on
Jul 1, 2013
Sold by
Jmm Rt
Bought by
Ousey Molly M
Home Financials for this Owner
Home Financials are based on the most recent Mortgage that was taken out on this home.
Original Mortgage
$264,000
Interest Rate
4%
Mortgage Type
Adjustable Rate Mortgage/ARM
Purchase Details
Closed on
May 2, 2005
Sold by
Carlyle Cq Boston Lp
Bought by
Jmm Rt
Create a Home Valuation Report for This Property
The Home Valuation Report is an in-depth analysis detailing your home's value as well as a comparison with similar homes in the area
Home Values in the Area
Average Home Value in this Area
Purchase History
| Date | Buyer | Sale Price | Title Company |
|---|---|---|---|
| Zhao Jinmo | $502,500 | -- | |
| Fournier Ryan | $486,000 | -- | |
| Ousey Molly M | $330,000 | -- | |
| Jmm Rt | $305,500 | -- |
Source: Public Records
Mortgage History
| Date | Status | Borrower | Loan Amount |
|---|---|---|---|
| Open | Zhao Jinmo | $300,000 | |
| Previous Owner | Fournier Ryan | $413,100 | |
| Previous Owner | Ousey Molly M | $264,000 | |
| Previous Owner | Ousey Molly M | $13,200 |
Source: Public Records
Tax History Compared to Growth
Tax History
| Year | Tax Paid | Tax Assessment Tax Assessment Total Assessment is a certain percentage of the fair market value that is determined by local assessors to be the total taxable value of land and additions on the property. | Land | Improvement |
|---|---|---|---|---|
| 2025 | $5,330 | $460,300 | $0 | $460,300 |
| 2024 | $4,828 | $442,900 | $0 | $442,900 |
| 2023 | $4,530 | $421,800 | $0 | $421,800 |
| 2022 | $4,499 | $413,500 | $0 | $413,500 |
| 2021 | $4,600 | $431,100 | $0 | $431,100 |
| 2020 | $4,391 | $415,800 | $0 | $415,800 |
| 2019 | $4,297 | $407,700 | $0 | $407,700 |
| 2018 | $4,115 | $392,700 | $0 | $392,700 |
| 2017 | $4,000 | $377,700 | $0 | $377,700 |
| 2016 | $3,919 | $356,300 | $0 | $356,300 |
| 2015 | $4,139 | $341,800 | $0 | $341,800 |
| 2014 | $3,778 | $300,300 | $0 | $300,300 |
Source: Public Records
About Parris Landing
Map
Nearby Homes
- 42 8th St Unit 5316
- 42 8th St Unit 4209
- 42 8th St Unit 4106
- 42 8th St Unit 1201
- 42 8th St Unit 3306
- 42 8th St Unit 2302
- 197 8th St Unit 501
- 197 Eighth St Unit 628
- 197 Eighth St Unit 212
- 106 13th St Unit 204
- 73 Chelsea St Unit 401
- 106 Bunker Hill St Unit 2
- 106 Bunker Hill St Unit 6
- 106 Bunker Hill St Unit 1
- 106 Bunker Hill St Unit 4P
- 106 Bunker Hill St Unit 3
- 5 Wallace Ct
- 17 Henley St Unit F
- 17 Henley St Unit B
- 3 Battery Wharf Unit 3309
- 42 8th St Unit 1511
- 42 8th St Unit 1507
- 42 8th St Unit 3106
- 42 8th St Unit 4113
- 42 8th St Unit 2321
- 42 8th St Unit 1504
- 42 8th St Unit 1411
- 42 8th St Unit 42 Eighth Street
- 42 8th St Unit 1314
- 42 8th St Unit 2515
- 42 8th St Unit 3414
- 42 8th St Unit 3107
- 42 8th St Unit 3505
- 42 8th St Unit 5312
- 42 8th St Unit 1410
- 42 8th St Unit 5519
- 42 8th St Unit 3210
- 42 8th St Unit 4309
- 42 8th St Unit 5524
- 42 8th St Unit 5525