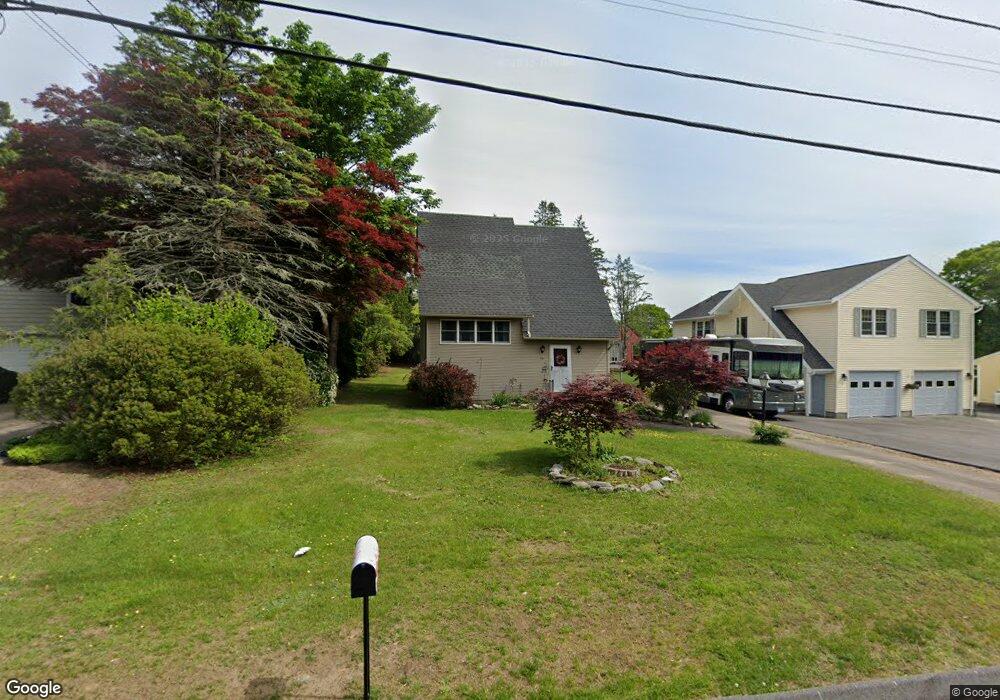
42 Babcock Rd Westerly, RI 02891
Estimated Value: $413,000 - $820,000
2
Beds
1
Bath
1,352
Sq Ft
$401/Sq Ft
Est. Value
About This Home
This home is located at 42 Babcock Rd, Westerly, RI 02891 and is currently estimated at $542,795, approximately $401 per square foot. 42 Babcock Rd is a home located in Washington County with nearby schools including Westerly High School and St. Michael School.
Ownership History
Date
Name
Owned For
Owner Type
Purchase Details
Closed on
Oct 17, 2000
Sold by
Lallo Linda F
Bought by
Avery Carol A
Current Estimated Value
Home Financials for this Owner
Home Financials are based on the most recent Mortgage that was taken out on this home.
Original Mortgage
$98,000
Outstanding Balance
$35,663
Interest Rate
7.89%
Estimated Equity
$507,132
Create a Home Valuation Report for This Property
The Home Valuation Report is an in-depth analysis detailing your home's value as well as a comparison with similar homes in the area
Home Values in the Area
Average Home Value in this Area
Purchase History
| Date | Buyer | Sale Price | Title Company |
|---|---|---|---|
| Avery Carol A | $41,500 | -- | |
| Avery Carol A | $41,500 | -- | |
| Avery Carol A | $41,500 | -- |
Source: Public Records
Mortgage History
| Date | Status | Borrower | Loan Amount |
|---|---|---|---|
| Open | Avery Carol A | $98,000 |
Source: Public Records
Tax History Compared to Growth
Tax History
| Year | Tax Paid | Tax Assessment Tax Assessment Total Assessment is a certain percentage of the fair market value that is determined by local assessors to be the total taxable value of land and additions on the property. | Land | Improvement |
|---|---|---|---|---|
| 2025 | $2,529 | $325,000 | $168,500 | $156,500 |
| 2024 | $2,542 | $243,300 | $120,400 | $122,900 |
| 2023 | $2,472 | $243,300 | $120,400 | $122,900 |
| 2022 | $2,457 | $243,300 | $120,400 | $122,900 |
| 2021 | $2,381 | $197,400 | $104,700 | $92,700 |
| 2020 | $2,339 | $197,400 | $104,700 | $92,700 |
| 2019 | $2,317 | $197,400 | $104,700 | $92,700 |
| 2018 | $2,288 | $185,300 | $104,700 | $80,600 |
| 2017 | $2,224 | $185,300 | $104,700 | $80,600 |
| 2016 | $2,224 | $185,300 | $104,700 | $80,600 |
| 2015 | $2,182 | $194,300 | $111,700 | $82,600 |
| 2014 | $2,147 | $194,300 | $111,700 | $82,600 |
Source: Public Records
Map
Nearby Homes
- 9 Cedar Crest Dr
- 2 Brass Ring Rd
- 18 Timothy Dr
- 5 Jana Rd
- 11 Hubbard St
- 3 Riverview Ave
- 28 Whipple Ave
- 7 Spring Pond Rd
- 24 Abbey Ln Unit 13
- 23 Abbey Ln Unit 12
- 18 No Bottom Ridge Ridge
- 6 Newbury Dr
- 13 No Bottom Ridge Rd
- 9 Compass Way Unit 201
- 9 Compass Way Unit 202
- 9 Compass Way Unit 101
- 9 Compass Way Unit 102
- 9 Compass Way Unit 103
- 9 Compass Way Unit 203
- 10 Tristam St