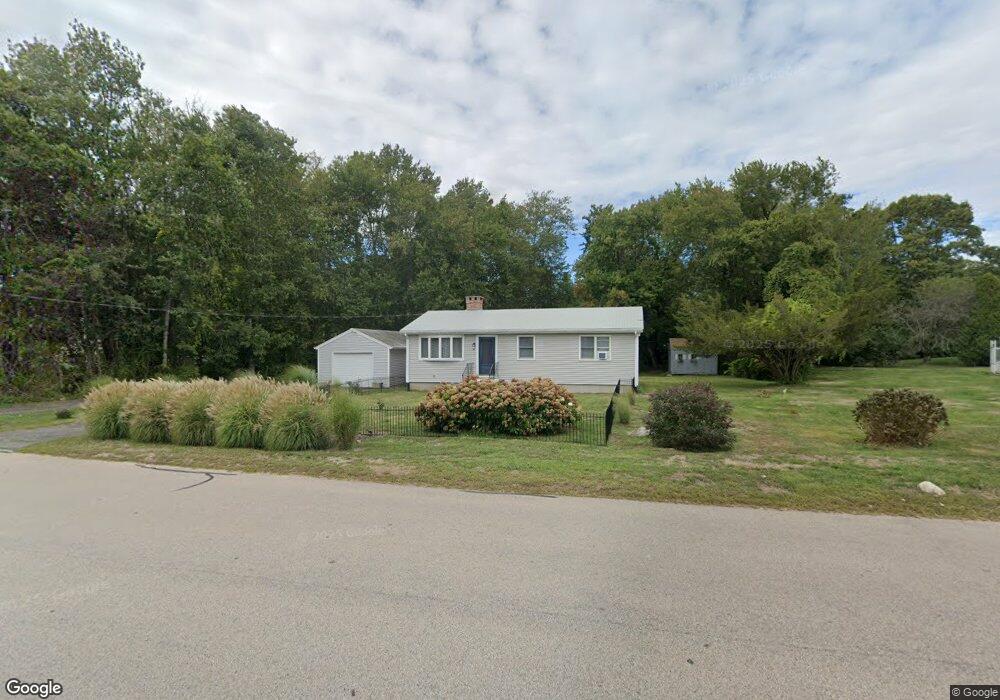
42 Boiling Spring Ave Westerly, RI 02891
Estimated Value: $385,000 - $511,000
2
Beds
1
Bath
960
Sq Ft
$461/Sq Ft
Est. Value
About This Home
This home is located at 42 Boiling Spring Ave, Westerly, RI 02891 and is currently estimated at $442,930, approximately $461 per square foot. 42 Boiling Spring Ave is a home located in Washington County with nearby schools including Westerly High School and St. Michael School.
Ownership History
Date
Name
Owned For
Owner Type
Purchase Details
Closed on
Nov 22, 2022
Sold by
Boyer Douglas B Est
Bought by
Neri Maria
Current Estimated Value
Purchase Details
Closed on
Sep 23, 2011
Sold by
Mackenzie Clarence C and Mackenzie Lorraine L
Bought by
Boyer Douglas
Home Financials for this Owner
Home Financials are based on the most recent Mortgage that was taken out on this home.
Original Mortgage
$140,000
Interest Rate
4.33%
Create a Home Valuation Report for This Property
The Home Valuation Report is an in-depth analysis detailing your home's value as well as a comparison with similar homes in the area
Home Values in the Area
Average Home Value in this Area
Purchase History
| Date | Buyer | Sale Price | Title Company |
|---|---|---|---|
| Neri Maria | $250,000 | None Available | |
| Boyer Douglas | $180,000 | -- |
Source: Public Records
Mortgage History
| Date | Status | Borrower | Loan Amount |
|---|---|---|---|
| Previous Owner | Boyer Douglas | $140,000 |
Source: Public Records
Tax History
| Year | Tax Paid | Tax Assessment Tax Assessment Total Assessment is a certain percentage of the fair market value that is determined by local assessors to be the total taxable value of land and additions on the property. | Land | Improvement |
|---|---|---|---|---|
| 2025 | $2,935 | $377,200 | $174,800 | $202,400 |
| 2024 | $2,638 | $252,400 | $125,400 | $127,000 |
| 2023 | $2,564 | $252,400 | $125,400 | $127,000 |
| 2022 | $2,549 | $252,400 | $125,400 | $127,000 |
| 2021 | $2,439 | $202,200 | $109,300 | $92,900 |
| 2020 | $2,396 | $202,200 | $109,300 | $92,900 |
| 2019 | $2,374 | $202,200 | $109,300 | $92,900 |
| 2018 | $2,281 | $184,700 | $109,300 | $75,400 |
| 2017 | $2,216 | $184,700 | $109,300 | $75,400 |
| 2016 | $2,216 | $184,700 | $109,300 | $75,400 |
| 2015 | $2,192 | $195,200 | $111,600 | $83,600 |
| 2014 | $2,157 | $195,200 | $111,600 | $83,600 |
Source: Public Records
Map
Nearby Homes
- 17 Apache Dr Unit G
- 22 Colonial Dr
- 19 Apache Dr Unit F
- 19 Apache Dr Unit 19C
- 0 Iroquois Ave
- 33 Whipple Ave
- 2 Marichris Dr
- 24 George St
- 21 Linden St
- 12 Batterson Ave
- 25 School St Unit 2
- 28 Spruce St
- 2 Gravity Ct
- 5 Marion St
- 23 Pond St
- 23 Abbey Ln Unit 12
- 9 Crestview Dr Unit C
- 24 Abbey Ln Unit 13
- 140 High St Unit 307
- 77 Mechanic St
- 47 Boiling Spring Ave
- 47 Boiling Spring Ave
- 2 Lee St
- 2 Holmes St
- 3 Holmes St
- 40 Boiling Spring Ave
- 1 Lee St
- 49 Boiling Spring Ave
- 4 Holmes St
- 38 Boiling Spring Ave
- 3 Lee St
- 2 Chord St
- 6 Lee St
- 50 Boiling Spring Ave
- 51 Boiling Spring Ave
- 5 Holmes St
- 4 Chord St
- 39 Boiling Spring Ave
- 36 Boiling Springs Ave
- 8 Holmes St
Your Personal Tour Guide
Ask me questions while you tour the home.