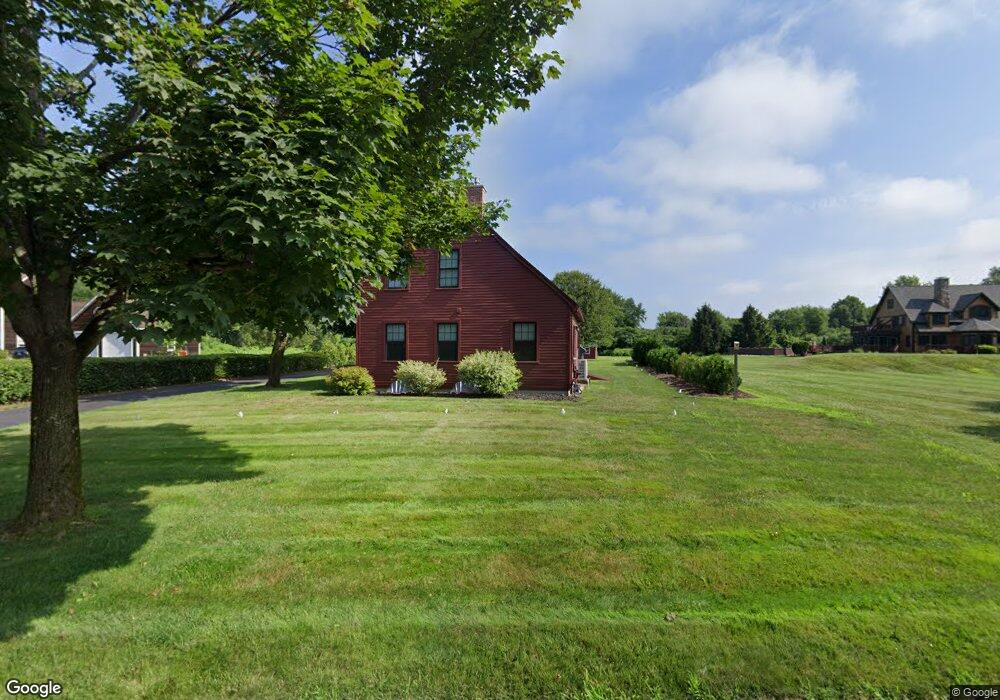
42 Bridge St Hatfield, MA 01038
Estimated Value: $506,000 - $538,000
2
Beds
2
Baths
1,636
Sq Ft
$322/Sq Ft
Est. Value
About This Home
This home is located at 42 Bridge St, Hatfield, MA 01038 and is currently estimated at $527,188, approximately $322 per square foot. 42 Bridge St is a home located in Hampshire County with nearby schools including Hatfield Elementary School and Smith Academy.
Ownership History
Date
Name
Owned For
Owner Type
Purchase Details
Closed on
Aug 15, 2008
Sold by
Deburro Joseph J and Deburro Kristen H
Bought by
Nowak Bethany A and Yagodzinski Christopher T
Current Estimated Value
Home Financials for this Owner
Home Financials are based on the most recent Mortgage that was taken out on this home.
Original Mortgage
$244,900
Interest Rate
6.4%
Mortgage Type
Purchase Money Mortgage
Purchase Details
Closed on
Jul 22, 2002
Sold by
Campbell Ann C and Campbell Norman C
Bought by
Deburro Joseph J and Deburro Kristen H
Create a Home Valuation Report for This Property
The Home Valuation Report is an in-depth analysis detailing your home's value as well as a comparison with similar homes in the area
Home Values in the Area
Average Home Value in this Area
Purchase History
| Date | Buyer | Sale Price | Title Company |
|---|---|---|---|
| Nowak Bethany A | $314,900 | -- | |
| Deburro Joseph J | $240,000 | -- |
Source: Public Records
Mortgage History
| Date | Status | Borrower | Loan Amount |
|---|---|---|---|
| Open | Deburro Joseph J | $240,000 | |
| Closed | Nowak Bethany A | $244,900 | |
| Previous Owner | Deburro Joseph J | $57,000 | |
| Previous Owner | Deburro Joseph J | $187,500 |
Source: Public Records
Tax History
| Year | Tax Paid | Tax Assessment Tax Assessment Total Assessment is a certain percentage of the fair market value that is determined by local assessors to be the total taxable value of land and additions on the property. | Land | Improvement |
|---|---|---|---|---|
| 2025 | $6,517 | $470,900 | $164,900 | $306,000 |
| 2024 | $6,476 | $423,000 | $144,100 | $278,900 |
| 2023 | $5,362 | $397,800 | $136,700 | $261,100 |
| 2022 | $5,221 | $381,900 | $130,000 | $251,900 |
| 2021 | $4,999 | $352,300 | $118,700 | $233,600 |
| 2020 | $4,767 | $352,300 | $118,700 | $233,600 |
| 2019 | $4,641 | $334,100 | $116,500 | $217,600 |
| 2018 | $4,536 | $334,000 | $116,400 | $217,600 |
| 2017 | $4,381 | $331,400 | $116,400 | $215,000 |
| 2016 | $4,343 | $329,500 | $116,400 | $213,100 |
| 2015 | $4,013 | $304,700 | $105,100 | $199,600 |
| 2014 | $3,880 | $306,200 | $105,100 | $201,100 |
Source: Public Records
Map
Nearby Homes
- 62 Bridge St
- 71 Chestnut St
- 18 Elm St
- 58 Main St Unit 4
- 58 Main St Unit 3
- 0 Straits Rd
- 59 N Hatfield Rd
- 0 Pantry Rd Unit 73430264
- 27 River Dr
- 11 West St
- 0 N Branch Rd
- 32 Stonewall Dr
- 26 Russell St Unit A-B
- 80 Damon Rd Unit 8201
- 80 Damon Rd Unit 5104
- 80 Damon Rd Unit 4302
- 88 Pines Edge Dr Unit 88
- 151 Pantry Rd
- 289 Hatfield St
- 133 Middle St
Your Personal Tour Guide
Ask me questions while you tour the home.