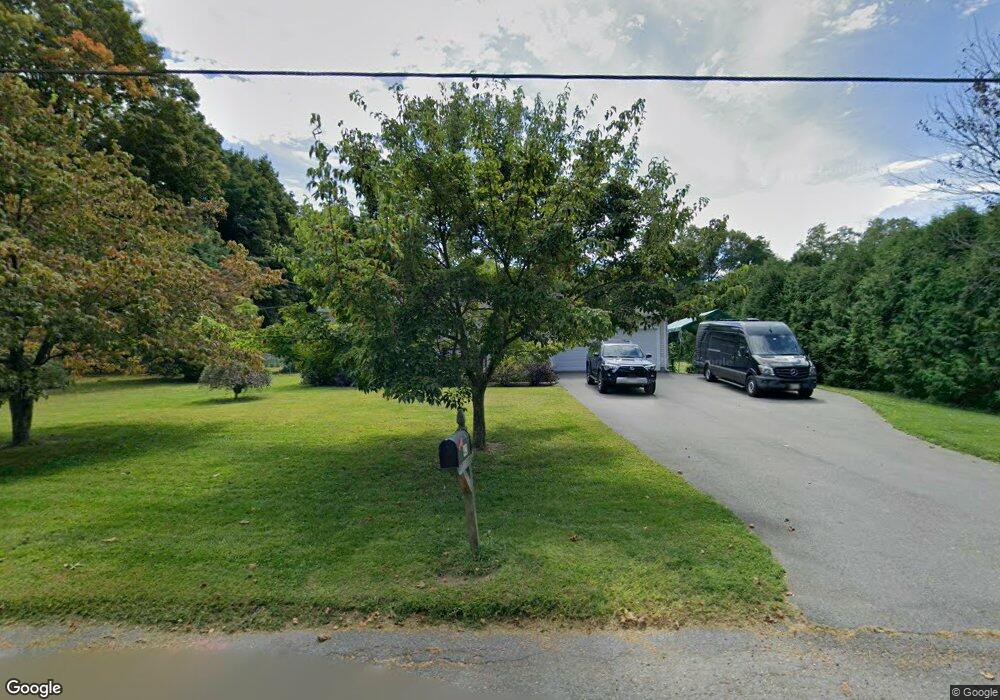
42 Clapp St Easthampton, MA 01027
Estimated Value: $351,000 - $447,000
2
Beds
1
Bath
816
Sq Ft
$464/Sq Ft
Est. Value
About This Home
This home is located at 42 Clapp St, Easthampton, MA 01027 and is currently estimated at $378,828, approximately $464 per square foot. 42 Clapp St is a home located in Hampshire County with nearby schools including Easthampton High School, Hilltown Cooperative Charter Public School, and Tri-County Schools.
Ownership History
Date
Name
Owned For
Owner Type
Purchase Details
Closed on
Sep 5, 2024
Sold by
Monska Mark W
Bought by
Monska Irt and Mccormick
Current Estimated Value
Purchase Details
Closed on
Sep 5, 2007
Sold by
Rogers Harold T
Bought by
Thibault Laura L and Monska Mark W
Home Financials for this Owner
Home Financials are based on the most recent Mortgage that was taken out on this home.
Original Mortgage
$181,600
Interest Rate
6.74%
Mortgage Type
Purchase Money Mortgage
Purchase Details
Closed on
May 25, 2006
Sold by
Sigda Francis J
Bought by
Rogers Harold T
Home Financials for this Owner
Home Financials are based on the most recent Mortgage that was taken out on this home.
Original Mortgage
$170,000
Interest Rate
6.53%
Mortgage Type
Purchase Money Mortgage
Purchase Details
Closed on
May 24, 1996
Sold by
Cody Ventures Inc
Bought by
Sigda Francis J
Create a Home Valuation Report for This Property
The Home Valuation Report is an in-depth analysis detailing your home's value as well as a comparison with similar homes in the area
Home Values in the Area
Average Home Value in this Area
Purchase History
| Date | Buyer | Sale Price | Title Company |
|---|---|---|---|
| Monska Irt | -- | None Available | |
| Monska Irt | -- | None Available | |
| Thibault Laura L | $227,000 | -- | |
| Rogers Harold T | $213,000 | -- | |
| Sigda Francis J | $106,400 | -- | |
| Thibault Laura L | $227,000 | -- | |
| Rogers Harold T | $213,000 | -- | |
| Sigda Francis J | $106,400 | -- |
Source: Public Records
Mortgage History
| Date | Status | Borrower | Loan Amount |
|---|---|---|---|
| Previous Owner | Thibault Laura L | $181,600 | |
| Previous Owner | Rogers Harold T | $170,000 | |
| Previous Owner | Sigda Francis J | $17,000 |
Source: Public Records
Tax History Compared to Growth
Tax History
| Year | Tax Paid | Tax Assessment Tax Assessment Total Assessment is a certain percentage of the fair market value that is determined by local assessors to be the total taxable value of land and additions on the property. | Land | Improvement |
|---|---|---|---|---|
| 2025 | $4,459 | $326,200 | $121,800 | $204,400 |
| 2024 | $4,305 | $317,500 | $118,300 | $199,200 |
| 2023 | $3,348 | $228,500 | $93,700 | $134,800 |
| 2022 | $3,777 | $228,500 | $93,700 | $134,800 |
| 2021 | $4,124 | $235,100 | $93,700 | $141,400 |
| 2020 | $4,058 | $228,500 | $93,700 | $134,800 |
| 2019 | $3,410 | $220,600 | $93,700 | $126,900 |
| 2018 | $3,278 | $204,900 | $88,500 | $116,400 |
| 2017 | $3,201 | $197,500 | $85,000 | $112,500 |
| 2016 | $3,079 | $197,500 | $85,000 | $112,500 |
| 2015 | $2,927 | $193,200 | $85,000 | $108,200 |
Source: Public Records
Map
Nearby Homes
- 10 Glen Cove Place Unit A
- 12 Glen Cove Place Unit B
- 2 Clinton St
- 108 Parsons St
- 98 Everett St
- 52-54 Everett St
- 33 Knipfer Ave
- 56 Olive St
- 95 Autumn Dr
- 19 Nicols Way Unit 19
- 57 Columbus Ave
- 25 Munroe St
- 86 Lyman Rd
- 38 West St
- 12 School St
- 723 Florence Rd
- 52 Williston Ave
- 78 Holyoke St
- 67 Old South St
- 35 New South St Unit 307