42 Crane Neck St West Newbury, MA 01985
Estimated Value: $699,653 - $805,000
2
Beds
2
Baths
1,512
Sq Ft
$502/Sq Ft
Est. Value
About This Home
This home is located at 42 Crane Neck St, West Newbury, MA 01985 and is currently estimated at $758,413, approximately $501 per square foot. 42 Crane Neck St is a home located in Essex County with nearby schools including Pentucket Regional High School.
Ownership History
Date
Name
Owned For
Owner Type
Purchase Details
Closed on
Jul 15, 2013
Sold by
Francescone Elsa L
Bought by
Elsa Francescone Ft and Francescone Elsa L
Current Estimated Value
Purchase Details
Closed on
Aug 30, 1996
Sold by
Anderson Clayton
Bought by
Francescone Elsa L
Create a Home Valuation Report for This Property
The Home Valuation Report is an in-depth analysis detailing your home's value as well as a comparison with similar homes in the area
Home Values in the Area
Average Home Value in this Area
Purchase History
| Date | Buyer | Sale Price | Title Company |
|---|---|---|---|
| Elsa Francescone Ft | -- | -- | |
| Francescone Elsa L | $170,000 | -- |
Source: Public Records
Mortgage History
| Date | Status | Borrower | Loan Amount |
|---|---|---|---|
| Previous Owner | Francescone Elsa L | $201,000 | |
| Previous Owner | Francescone Elsa L | $30,000 | |
| Previous Owner | Francescone Elsa L | $138,000 |
Source: Public Records
Tax History Compared to Growth
Tax History
| Year | Tax Paid | Tax Assessment Tax Assessment Total Assessment is a certain percentage of the fair market value that is determined by local assessors to be the total taxable value of land and additions on the property. | Land | Improvement |
|---|---|---|---|---|
| 2025 | $6,711 | $621,400 | $386,400 | $235,000 |
| 2024 | $6,672 | $616,600 | $378,100 | $238,500 |
| 2023 | $6,448 | $584,600 | $350,200 | $234,400 |
| 2022 | $6,191 | $475,900 | $275,300 | $200,600 |
| 2021 | $6,098 | $409,800 | $253,500 | $156,300 |
| 2020 | $5,909 | $409,800 | $253,500 | $156,300 |
| 2019 | $5,974 | $410,000 | $242,600 | $167,400 |
| 2018 | $5,544 | $380,800 | $231,700 | $149,100 |
| 2017 | $5,382 | $369,900 | $220,800 | $149,100 |
| 2016 | $5,252 | $359,000 | $209,900 | $149,100 |
| 2015 | $5,168 | $329,400 | $194,700 | $134,700 |
Source: Public Records
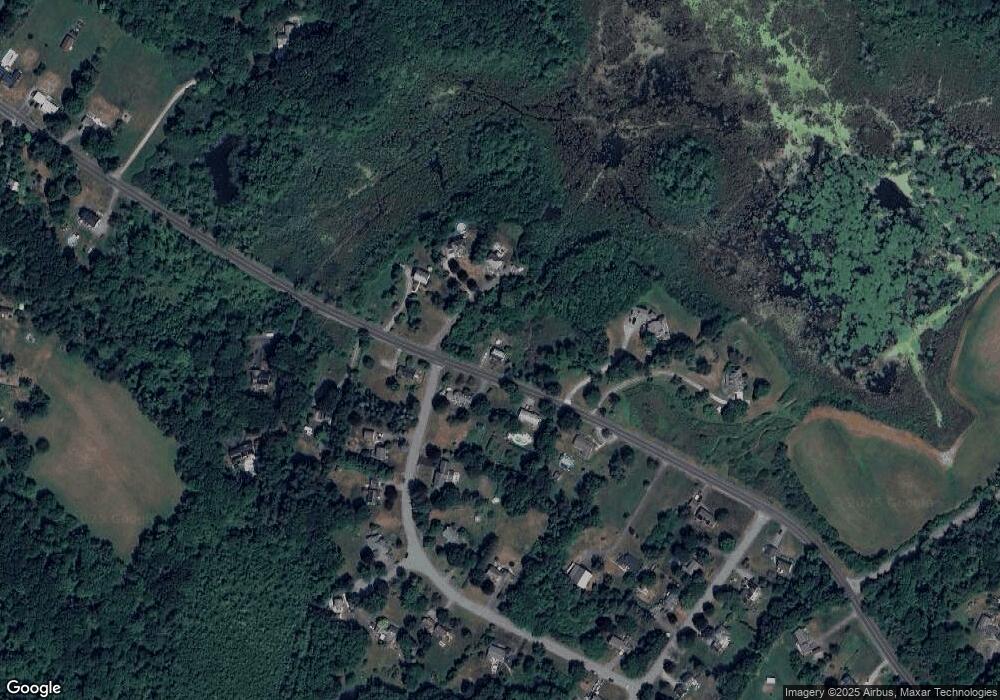
Map
Nearby Homes
- 4 Barberry Ln
- 3 Marshall Dr
- 29 Pleasant St
- 22-26 Wood St
- 27 Rivercrest Dr
- 167 Middle St
- 8 Wood St
- 4 Stewart St Unit 4
- 43 Prospect St
- 20 Albion Ln
- 0 E Broadway Unit 73335816
- 7 Marjorie St
- 3 Marjorie St
- 280 E Broadway
- 528 Main St Unit A
- 71 Old Amesbury Line Rd
- 591 Main St
- 2 River Rd
- 21 Francis Ave
- 120 Middle Rd
- 39 Crane Neck St
- 43 Crane Neck St
- 38 Crane Neck St
- 34 Crane Neck St
- 37 Crane Neck St
- 36 Crane Neck St
- 4 Robin Rd
- 47 Crane Neck St
- 3 Robin Rd
- 46 Crane Neck St
- 8 Robin Rd
- 5 Robin Rd
- 33 Crane Neck St
- 10 Robin Rd
- 50 Crane Neck St
- 7 Robin Rd
- 21 Crane Neck St
- 53 Crane Neck St
- 55 Crane Neck St
- 19 Crane Neck St