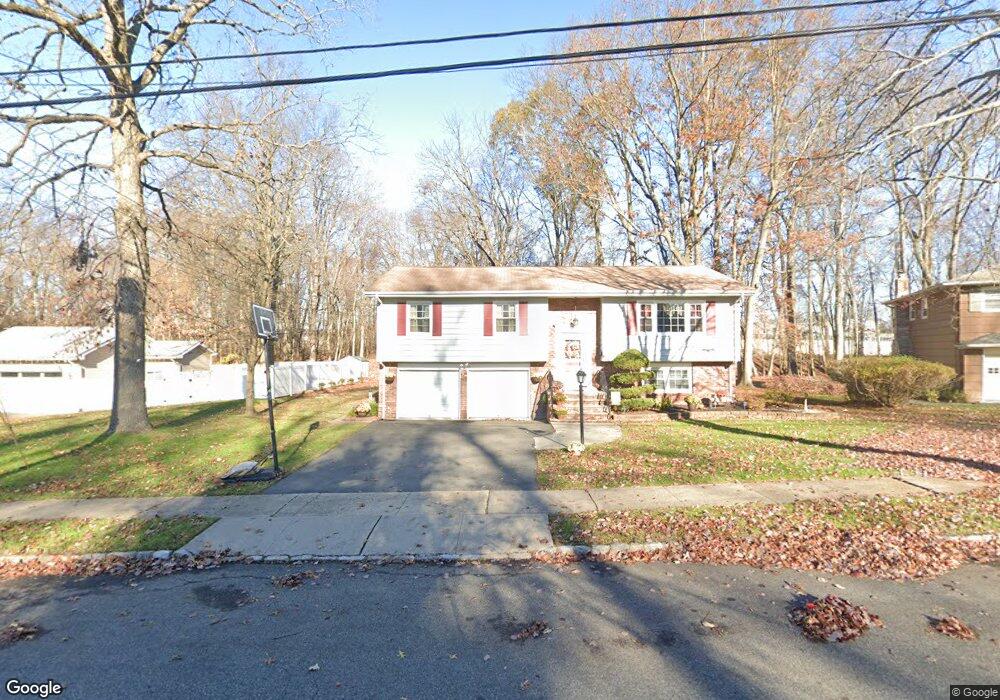
42 Davenport Ave Roseland, NJ 07068
Estimated Value: $909,000 - $942,000
--
Bed
--
Bath
2,306
Sq Ft
$399/Sq Ft
Est. Value
About This Home
This home is located at 42 Davenport Ave, Roseland, NJ 07068 and is currently estimated at $919,079, approximately $398 per square foot. 42 Davenport Ave is a home located in Essex County with nearby schools including Lester C. Noecker Elementary School, West Essex Middle School, and West Essex High School.
Ownership History
Date
Name
Owned For
Owner Type
Purchase Details
Closed on
May 27, 2021
Sold by
Gibbs Kim and Kuscin Kim M
Bought by
Gibbs Kim and Gibbs Gilbert
Current Estimated Value
Purchase Details
Closed on
Apr 2, 2014
Sold by
Kuscin James J
Bought by
Kuscin Kim M
Home Financials for this Owner
Home Financials are based on the most recent Mortgage that was taken out on this home.
Original Mortgage
$144,500
Interest Rate
4.32%
Mortgage Type
New Conventional
Purchase Details
Closed on
Sep 26, 1997
Sold by
Little Everet
Bought by
Kuschin James and Kuschin Kim
Home Financials for this Owner
Home Financials are based on the most recent Mortgage that was taken out on this home.
Original Mortgage
$182,000
Interest Rate
7.31%
Purchase Details
Closed on
Jun 21, 1991
Sold by
Monte Peter and Monte Raffaela
Bought by
Little Everet and Little Carna
Create a Home Valuation Report for This Property
The Home Valuation Report is an in-depth analysis detailing your home's value as well as a comparison with similar homes in the area
Home Values in the Area
Average Home Value in this Area
Purchase History
| Date | Buyer | Sale Price | Title Company |
|---|---|---|---|
| Gibbs Kim | -- | Old Republic Natl Ttl Ins Co | |
| Kuscin Kim M | -- | None Available | |
| Kuschin James | $242,000 | -- | |
| Little Everet | $240,000 | -- |
Source: Public Records
Mortgage History
| Date | Status | Borrower | Loan Amount |
|---|---|---|---|
| Previous Owner | Kuscin Kim M | $144,500 | |
| Previous Owner | Kuschin James | $182,000 |
Source: Public Records
Tax History Compared to Growth
Tax History
| Year | Tax Paid | Tax Assessment Tax Assessment Total Assessment is a certain percentage of the fair market value that is determined by local assessors to be the total taxable value of land and additions on the property. | Land | Improvement |
|---|---|---|---|---|
| 2025 | $10,679 | $729,300 | $331,900 | $397,400 |
| 2024 | $10,679 | $729,300 | $331,900 | $397,400 |
| 2022 | $10,771 | $461,300 | $245,600 | $215,700 |
| 2021 | $10,624 | $461,300 | $245,600 | $215,700 |
| 2020 | $10,587 | $461,300 | $245,600 | $215,700 |
| 2019 | $10,490 | $461,300 | $245,600 | $215,700 |
| 2018 | $10,398 | $461,300 | $245,600 | $215,700 |
| 2017 | $10,393 | $461,300 | $245,600 | $215,700 |
| 2016 | $10,232 | $461,300 | $245,600 | $215,700 |
| 2015 | $10,255 | $461,300 | $245,600 | $215,700 |
| 2014 | $9,969 | $461,300 | $245,600 | $215,700 |
Source: Public Records
Map
Nearby Homes
- 4 Williamsburg Dr
- 39 Schweinberg Dr Unit 2039
- 39 Schweinberg Dr
- 30 Schweinberg Dr
- 192 Eagle Rock Ave
- 34 Lincoln St
- 26 Bovensiepen Ct
- 26 Bovensiepen Ct Unit 3526
- 201 Eagle Rock Ave
- 37 Dalewood Rd
- 58 Leonard Terrace
- 194 Eagle Rock Ave
- 88 Kent Dr Unit C0176
- 178 Passaic Ave
- 144 Passaic Ave
- 27-29 Roseland Ave
- 18 Harkey Ct Unit 63
- 18 Harkey Ct Unit C0063
- 9 Roseland Ave
- 11 Monroe Ave
- 40 Davenport Ave
- 44 Davenport Ave
- 41 Davenport Ave
- 38 Davenport Ave
- 43 Davenport Ave
- 45 Davenport Ave
- 36 Davenport Ave
- 3 Williamsburg Dr
- 48 Davenport Ave
- 12 Cobb Terrace
- 34 Davenport Ave
- 47 Davenport Ave
- 5 Williamsburg Dr
- 35 Davenport Ave
- 8 Cobb Terrace
- 32 Davenport Ave
- 7 Williamsburg Dr
- 33 Davenport Ave
- 22 Conover Ave
- 53 Davenport Ave