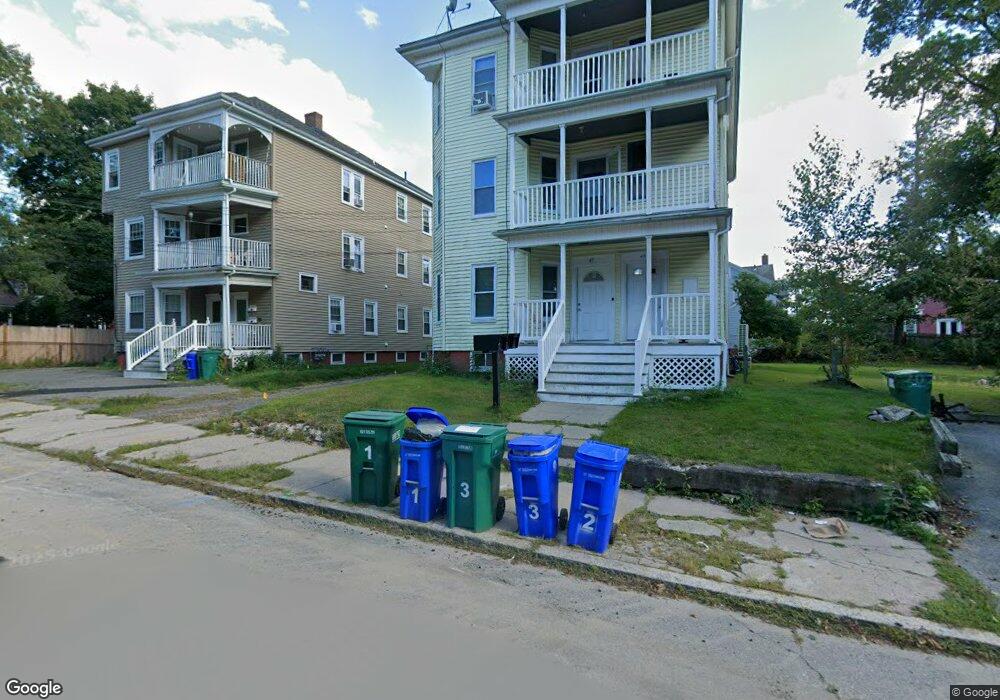
42 Elizabeth St Unit 2 Attleboro, MA 02703
Estimated Value: $700,968 - $795,000
3
Beds
1
Bath
4,098
Sq Ft
$183/Sq Ft
Est. Value
About This Home
This home is located at 42 Elizabeth St Unit 2, Attleboro, MA 02703 and is currently estimated at $749,492, approximately $182 per square foot. 42 Elizabeth St Unit 2 is a home located in Bristol County with nearby schools including Thomas E. Willett School, Cyril K. Brennan Middle School, and Attleboro High School.
Ownership History
Date
Name
Owned For
Owner Type
Purchase Details
Closed on
Nov 19, 2024
Sold by
Augustin James
Bought by
James Augustin Ret and Ausutin
Current Estimated Value
Purchase Details
Closed on
Jul 13, 2023
Sold by
Desir Marie A
Bought by
Augustin James
Home Financials for this Owner
Home Financials are based on the most recent Mortgage that was taken out on this home.
Original Mortgage
$567,765
Interest Rate
6.15%
Mortgage Type
FHA
Purchase Details
Closed on
Sep 10, 2020
Sold by
Simmons Michael P and Simmons Patricia M
Bought by
Ange-Desir Marie and Rameau Myrtha
Home Financials for this Owner
Home Financials are based on the most recent Mortgage that was taken out on this home.
Original Mortgage
$506,653
Interest Rate
2.9%
Mortgage Type
FHA
Purchase Details
Closed on
Jan 1, 1985
Bought by
Simmons Michael P and Simmons Patricia M
Create a Home Valuation Report for This Property
The Home Valuation Report is an in-depth analysis detailing your home's value as well as a comparison with similar homes in the area
Home Values in the Area
Average Home Value in this Area
Purchase History
| Date | Buyer | Sale Price | Title Company |
|---|---|---|---|
| James Augustin Ret | -- | None Available | |
| James Augustin Ret | -- | None Available | |
| Augustin James | $640,000 | None Available | |
| Ange-Desir Marie | $516,000 | None Available | |
| Simmons Michael P | -- | -- |
Source: Public Records
Mortgage History
| Date | Status | Borrower | Loan Amount |
|---|---|---|---|
| Previous Owner | Augustin James | $567,765 | |
| Previous Owner | Ange-Desir Marie | $506,653 | |
| Previous Owner | Simmons Michael P | $163,000 | |
| Previous Owner | Simmons Michael P | $131,950 | |
| Previous Owner | Simmons Michael P | $140,000 |
Source: Public Records
Tax History Compared to Growth
Tax History
| Year | Tax Paid | Tax Assessment Tax Assessment Total Assessment is a certain percentage of the fair market value that is determined by local assessors to be the total taxable value of land and additions on the property. | Land | Improvement |
|---|---|---|---|---|
| 2025 | $10,561 | $841,500 | $129,500 | $712,000 |
| 2024 | $9,379 | $736,800 | $129,500 | $607,300 |
| 2023 | $8,244 | $602,200 | $117,700 | $484,500 |
| 2022 | $7,448 | $515,400 | $112,100 | $403,300 |
| 2021 | $6,207 | $419,400 | $107,800 | $311,600 |
| 2020 | $5,805 | $398,700 | $104,700 | $294,000 |
| 2019 | $5,488 | $387,600 | $102,700 | $284,900 |
| 2018 | $2,298 | $337,300 | $99,700 | $237,600 |
| 2017 | $4,962 | $341,000 | $99,700 | $241,300 |
| 2016 | $4,541 | $306,400 | $97,900 | $208,500 |
| 2015 | $4,261 | $289,700 | $97,900 | $191,800 |
| 2014 | $3,938 | $265,200 | $93,200 | $172,000 |
Source: Public Records
Map
Nearby Homes
- 29 Hodges St
- 43 Elizabeth St
- 62 Elizabeth St
- 10 John St
- 140 N Main St Unit 3B
- 64 Mechanic St Unit 3
- 64 Mechanic St
- 46 Berwick Rd
- 392 N Main St
- 17 1st St
- 74 West St Unit 5
- 54 Bank St
- 24 Park St Unit 4F
- 125 County St
- 32 Park St Unit 4
- 49 Dennis St
- 6 & 6R Holman St
- 8 Holman St
- 21 Dennis St
- 10 Holman St Unit A
- 42 Elizabeth St
- 42 Elizabeth St Unit 1
- 44 Elizabeth St Unit 3
- 38 Elizabeth St
- 38 Elizabeth St Unit 1
- 46 Elizabeth St
- 31 John St
- 31 John St Unit 3rd
- 37 Elizabeth St
- 32 Elizabeth St
- 37 John St
- 35 Elizabeth St
- 35 John St
- 41 John St Unit 3
- 41 John St Unit 2
- 33 Elizabeth St
- 39 John St
- 39 John St Unit 1
- 25 John St
- 25 John St Unit 3