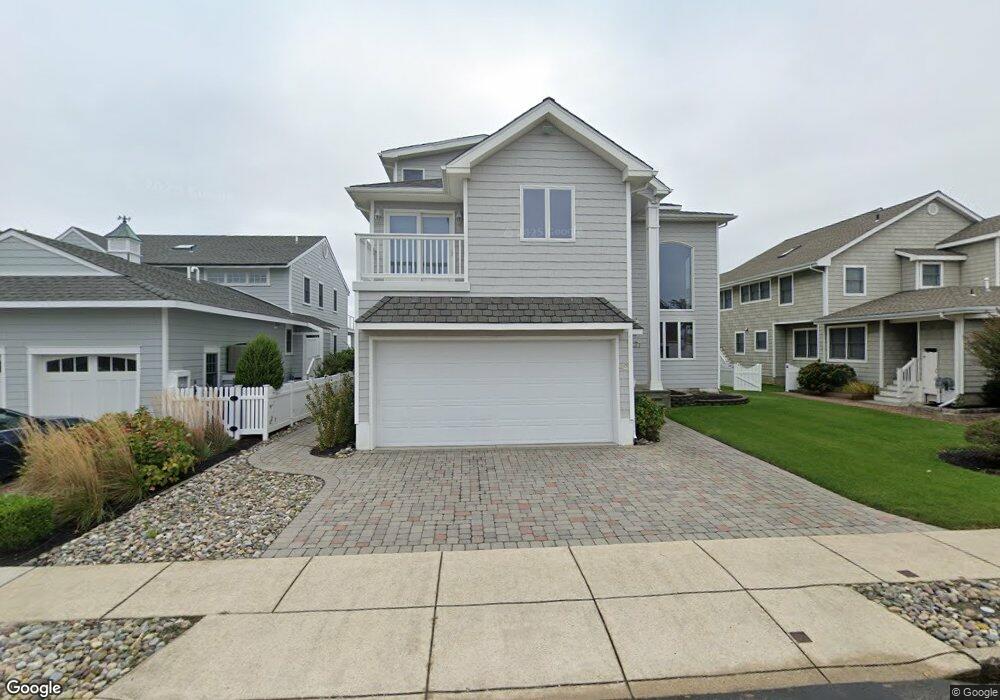
42 Flamingo Dr Avalon, NJ 08202
Estimated Value: $7,346,000 - $7,934,564
--
Bed
--
Bath
5,496
Sq Ft
$1,402/Sq Ft
Est. Value
About This Home
This home is located at 42 Flamingo Dr, Avalon, NJ 08202 and is currently estimated at $7,705,188, approximately $1,401 per square foot. 42 Flamingo Dr is a home with nearby schools including Avalon Elementary School.
Ownership History
Date
Name
Owned For
Owner Type
Purchase Details
Closed on
Sep 10, 2024
Sold by
Castle Marian E
Bought by
Marian E Castle Revocable Trust and Castle
Current Estimated Value
Purchase Details
Closed on
Aug 10, 1994
Sold by
Hall James E
Bought by
Castle Jeffry and Castle Marian E
Home Financials for this Owner
Home Financials are based on the most recent Mortgage that was taken out on this home.
Original Mortgage
$250,000
Interest Rate
8.52%
Create a Home Valuation Report for This Property
The Home Valuation Report is an in-depth analysis detailing your home's value as well as a comparison with similar homes in the area
Home Values in the Area
Average Home Value in this Area
Purchase History
| Date | Buyer | Sale Price | Title Company |
|---|---|---|---|
| Marian E Castle Revocable Trust | -- | None Listed On Document | |
| Marian E Castle Revocable Trust | -- | None Listed On Document | |
| Castle Jeffry | $500,000 | -- |
Source: Public Records
Mortgage History
| Date | Status | Borrower | Loan Amount |
|---|---|---|---|
| Previous Owner | Castle Jeffry | $250,000 |
Source: Public Records
Tax History Compared to Growth
Tax History
| Year | Tax Paid | Tax Assessment Tax Assessment Total Assessment is a certain percentage of the fair market value that is determined by local assessors to be the total taxable value of land and additions on the property. | Land | Improvement |
|---|---|---|---|---|
| 2025 | $25,647 | $4,177,000 | $2,400,000 | $1,777,000 |
| 2024 | $25,647 | $4,177,000 | $2,400,000 | $1,777,000 |
| 2023 | $25,438 | $4,177,000 | $2,400,000 | $1,777,000 |
| 2022 | $23,725 | $4,177,000 | $2,400,000 | $1,777,000 |
| 2021 | $22,848 | $4,177,000 | $2,400,000 | $1,777,000 |
| 2020 | $21,971 | $4,177,000 | $2,400,000 | $1,777,000 |
| 2019 | $21,303 | $4,177,000 | $2,400,000 | $1,777,000 |
| 2018 | $20,384 | $4,177,000 | $2,400,000 | $1,777,000 |
| 2017 | $19,353 | $3,480,800 | $1,850,000 | $1,630,800 |
| 2016 | $19,144 | $3,480,800 | $1,850,000 | $1,630,800 |
| 2015 | $18,831 | $3,480,800 | $1,850,000 | $1,630,800 |
| 2014 | $18,622 | $3,480,800 | $1,850,000 | $1,630,800 |
Source: Public Records
Map
Nearby Homes