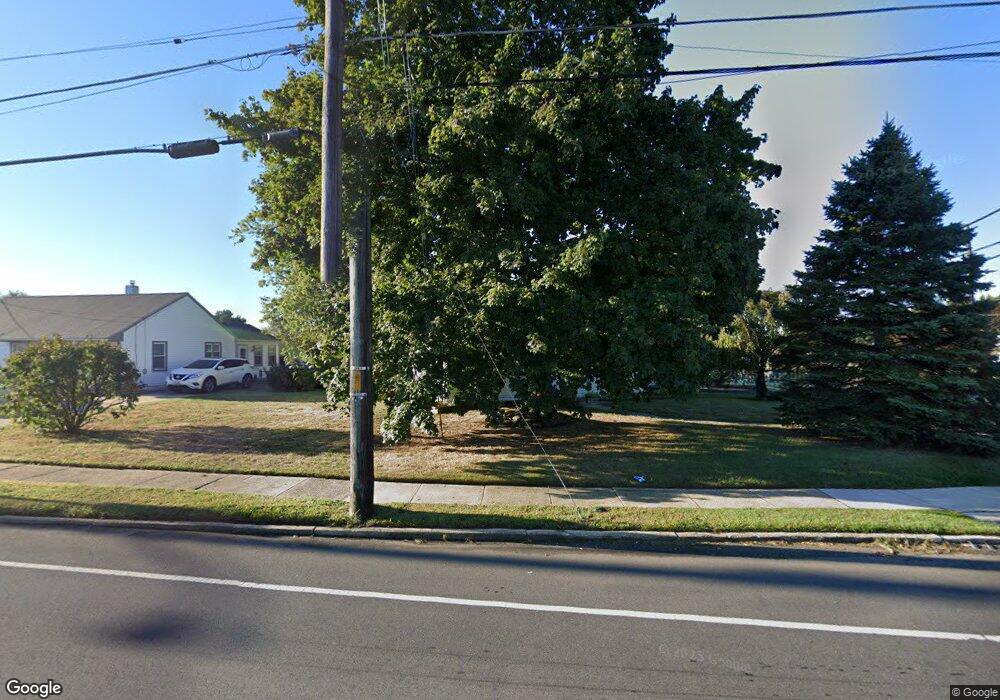
42 Fort Dix Rd Pemberton, NJ 08068
Estimated Value: $205,376 - $330,000
--
Bed
--
Bath
988
Sq Ft
$285/Sq Ft
Est. Value
About This Home
This home is located at 42 Fort Dix Rd, Pemberton, NJ 08068 and is currently estimated at $281,844, approximately $285 per square foot. 42 Fort Dix Rd is a home located in Burlington County.
Ownership History
Date
Name
Owned For
Owner Type
Purchase Details
Closed on
Sep 26, 1997
Sold by
The Salt & Light Company Inc
Bought by
Timberlake Barbara L
Current Estimated Value
Home Financials for this Owner
Home Financials are based on the most recent Mortgage that was taken out on this home.
Original Mortgage
$58,600
Outstanding Balance
$9,423
Interest Rate
7.46%
Estimated Equity
$272,421
Purchase Details
Closed on
Aug 15, 1997
Sold by
Hud
Bought by
The Salt & Light Company Inc
Home Financials for this Owner
Home Financials are based on the most recent Mortgage that was taken out on this home.
Original Mortgage
$58,600
Outstanding Balance
$9,423
Interest Rate
7.46%
Estimated Equity
$272,421
Purchase Details
Closed on
Mar 10, 1997
Sold by
Daniels Gary L
Bought by
Hud
Home Financials for this Owner
Home Financials are based on the most recent Mortgage that was taken out on this home.
Original Mortgage
$78,281
Interest Rate
7.55%
Purchase Details
Closed on
Aug 4, 1995
Sold by
Stevens Gary
Bought by
Pawloski Richard J and Pawlowski Kimberly A
Create a Home Valuation Report for This Property
The Home Valuation Report is an in-depth analysis detailing your home's value as well as a comparison with similar homes in the area
Home Values in the Area
Average Home Value in this Area
Purchase History
| Date | Buyer | Sale Price | Title Company |
|---|---|---|---|
| Timberlake Barbara L | $61,735 | -- | |
| The Salt & Light Company Inc | $46,000 | Surety Title Corporation | |
| Hud | -- | -- | |
| Pawloski Richard J | $72,000 | Imperial Title Agency Inc | |
| Stevens Gary | $39,900 | Imperial Title Agency Inc |
Source: Public Records
Mortgage History
| Date | Status | Borrower | Loan Amount |
|---|---|---|---|
| Open | Timberlake Barbara L | $58,600 | |
| Previous Owner | The Salt & Light Company Inc | $35,190 | |
| Previous Owner | Hud | $78,281 |
Source: Public Records
Tax History Compared to Growth
Tax History
| Year | Tax Paid | Tax Assessment Tax Assessment Total Assessment is a certain percentage of the fair market value that is determined by local assessors to be the total taxable value of land and additions on the property. | Land | Improvement |
|---|---|---|---|---|
| 2025 | $3,568 | $116,400 | $31,300 | $85,100 |
| 2024 | $3,348 | $116,400 | $31,300 | $85,100 |
| 2023 | $3,348 | $116,400 | $31,300 | $85,100 |
| 2022 | $3,099 | $116,400 | $31,300 | $85,100 |
| 2021 | $2,754 | $116,400 | $31,300 | $85,100 |
| 2020 | $2,860 | $116,400 | $31,300 | $85,100 |
| 2019 | $2,739 | $116,400 | $31,300 | $85,100 |
| 2018 | $2,646 | $116,400 | $31,300 | $85,100 |
| 2017 | $2,591 | $116,400 | $31,300 | $85,100 |
| 2016 | $2,456 | $65,700 | $21,500 | $44,200 |
| 2015 | $2,436 | $65,700 | $21,500 | $44,200 |
| 2014 | $2,329 | $65,700 | $21,500 | $44,200 |
Source: Public Records
Map
Nearby Homes
- 10 Sheldon Rd
- 0 N Pemberton Rd Unit NJBL2097176
- 30 Homestead Dr
- 121 Jane St
- 63 Homestead Dr
- 23 Homestead Dr
- 60 Hanover St
- 38 Hearthstone Blvd
- 110 Lemmon Ave
- 112 Kinsley Rd
- 120 Hanover St
- 141 Arneys Mount Rd
- 2 Cedar Ln
- 914 Pemberton Browns Mills Rd
- 912 Pemberton Browns Mills Rd
- 912 Pemberton - Browns Mills Rd
- 200 Norcross Ln Unit 202
- 197 Kinsley Rd
- 216 Kinsley Rd
- 227 Kinsley Rd