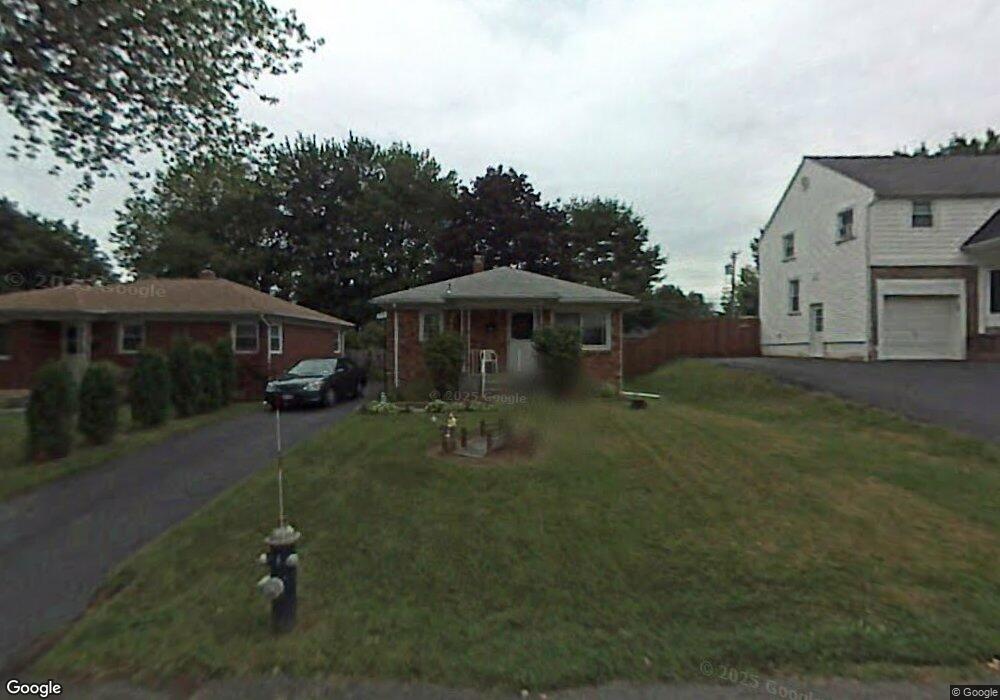
42 Glynn St Albany, NY 12203
Campus Area NeighborhoodEstimated Value: $248,000 - $275,000
3
Beds
1
Bath
1,014
Sq Ft
$257/Sq Ft
Est. Value
About This Home
This home is located at 42 Glynn St, Albany, NY 12203 and is currently estimated at $260,687, approximately $257 per square foot. 42 Glynn St is a home located in Albany County with nearby schools including Eagle Point Elementary School, William S Hackett Middle School, and Albany High School.
Ownership History
Date
Name
Owned For
Owner Type
Purchase Details
Closed on
Oct 21, 2010
Sold by
Jennings Mary Ann and Parillo Catherine M
Bought by
Justice John S
Current Estimated Value
Home Financials for this Owner
Home Financials are based on the most recent Mortgage that was taken out on this home.
Original Mortgage
$138,600
Outstanding Balance
$76,478
Interest Rate
4.99%
Estimated Equity
$184,209
Purchase Details
Closed on
Jan 2, 2002
Create a Home Valuation Report for This Property
The Home Valuation Report is an in-depth analysis detailing your home's value as well as a comparison with similar homes in the area
Home Values in the Area
Average Home Value in this Area
Purchase History
| Date | Buyer | Sale Price | Title Company |
|---|---|---|---|
| Justice John S | $154,000 | None Available | |
| -- | -- | -- |
Source: Public Records
Mortgage History
| Date | Status | Borrower | Loan Amount |
|---|---|---|---|
| Open | Justice John S | $138,600 |
Source: Public Records
Tax History Compared to Growth
Tax History
| Year | Tax Paid | Tax Assessment Tax Assessment Total Assessment is a certain percentage of the fair market value that is determined by local assessors to be the total taxable value of land and additions on the property. | Land | Improvement |
|---|---|---|---|---|
| 2024 | $5,190 | $218,000 | $43,600 | $174,400 |
| 2023 | $4,926 | $136,000 | $27,000 | $109,000 |
| 2022 | $4,741 | $136,000 | $27,000 | $109,000 |
| 2021 | $4,705 | $136,000 | $27,000 | $109,000 |
| 2020 | $4,522 | $136,000 | $27,000 | $109,000 |
| 2019 | $5,354 | $136,000 | $27,000 | $109,000 |
| 2018 | $4,522 | $136,000 | $27,000 | $109,000 |
| 2017 | $2,418 | $136,000 | $27,000 | $109,000 |
| 2016 | $4,392 | $136,000 | $27,000 | $109,000 |
| 2015 | $4,933 | $152,000 | $30,400 | $121,600 |
| 2014 | -- | $152,000 | $30,400 | $121,600 |
Source: Public Records
Map
Nearby Homes