42 Grove Ave Shelby, OH 44875
Estimated Value: $123,000 - $168,000
3
Beds
2
Baths
1,371
Sq Ft
$100/Sq Ft
Est. Value
About This Home
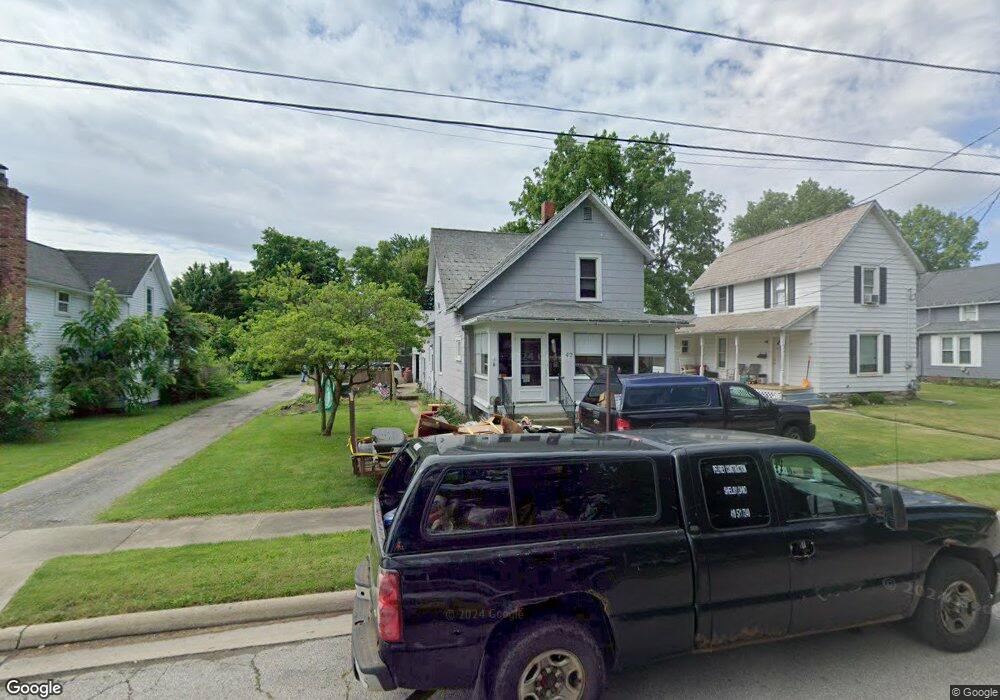
This home is located at 42 Grove Ave, Shelby, OH 44875 and is currently estimated at $136,638, approximately $99 per square foot. 42 Grove Ave is a home located in Richland County with nearby schools including St. Mary's School.
Ownership History
Date
Name
Owned For
Owner Type
Purchase Details
Closed on
Jul 15, 2005
Sold by
Smith Brent E and Mcfarland Christy A
Bought by
Pelfrey Randall D and Pelfrey Sherry D
Current Estimated Value
Home Financials for this Owner
Home Financials are based on the most recent Mortgage that was taken out on this home.
Original Mortgage
$18,800
Interest Rate
5.74%
Mortgage Type
Stand Alone Second
Purchase Details
Closed on
Jul 30, 2001
Sold by
Roark Ray G
Bought by
Smith Brent E and Mcfarland Chrisy A
Home Financials for this Owner
Home Financials are based on the most recent Mortgage that was taken out on this home.
Original Mortgage
$76,000
Interest Rate
7.16%
Mortgage Type
New Conventional
Purchase Details
Closed on
Jul 31, 1995
Sold by
Johnson David L
Bought by
Mcfarland Roark R and Mcfarland Pamela R
Home Financials for this Owner
Home Financials are based on the most recent Mortgage that was taken out on this home.
Original Mortgage
$54,800
Interest Rate
7.59%
Mortgage Type
New Conventional
Create a Home Valuation Report for This Property
The Home Valuation Report is an in-depth analysis detailing your home's value as well as a comparison with similar homes in the area
Home Values in the Area
Average Home Value in this Area
Purchase History
| Date | Buyer | Sale Price | Title Company |
|---|---|---|---|
| Pelfrey Randall D | $94,000 | Southern Title | |
| Smith Brent E | $80,000 | -- | |
| Mcfarland Roark R | $62,000 | -- |
Source: Public Records
Mortgage History
| Date | Status | Borrower | Loan Amount |
|---|---|---|---|
| Closed | Pelfrey Randall D | $18,800 | |
| Open | Pelfrey Randall D | $75,200 | |
| Closed | Smith Brent E | $76,000 | |
| Previous Owner | Mcfarland Roark R | $54,800 |
Source: Public Records
Tax History Compared to Growth
Tax History
| Year | Tax Paid | Tax Assessment Tax Assessment Total Assessment is a certain percentage of the fair market value that is determined by local assessors to be the total taxable value of land and additions on the property. | Land | Improvement |
|---|---|---|---|---|
| 2024 | $1,146 | $30,000 | $4,150 | $25,850 |
| 2023 | $1,146 | $30,000 | $4,150 | $25,850 |
| 2022 | $1,193 | $27,930 | $4,200 | $23,730 |
| 2021 | $1,194 | $27,930 | $4,200 | $23,730 |
| 2020 | $1,195 | $27,930 | $4,200 | $23,730 |
| 2019 | $1,104 | $23,670 | $3,560 | $20,110 |
| 2018 | $1,093 | $23,670 | $3,560 | $20,110 |
| 2017 | $1,085 | $23,670 | $3,560 | $20,110 |
| 2016 | $1,086 | $23,910 | $3,380 | $20,530 |
| 2015 | $1,080 | $23,910 | $3,380 | $20,530 |
| 2014 | $1,044 | $23,910 | $3,380 | $20,530 |
| 2012 | $513 | $23,910 | $3,560 | $20,350 |
Source: Public Records
Map
Nearby Homes