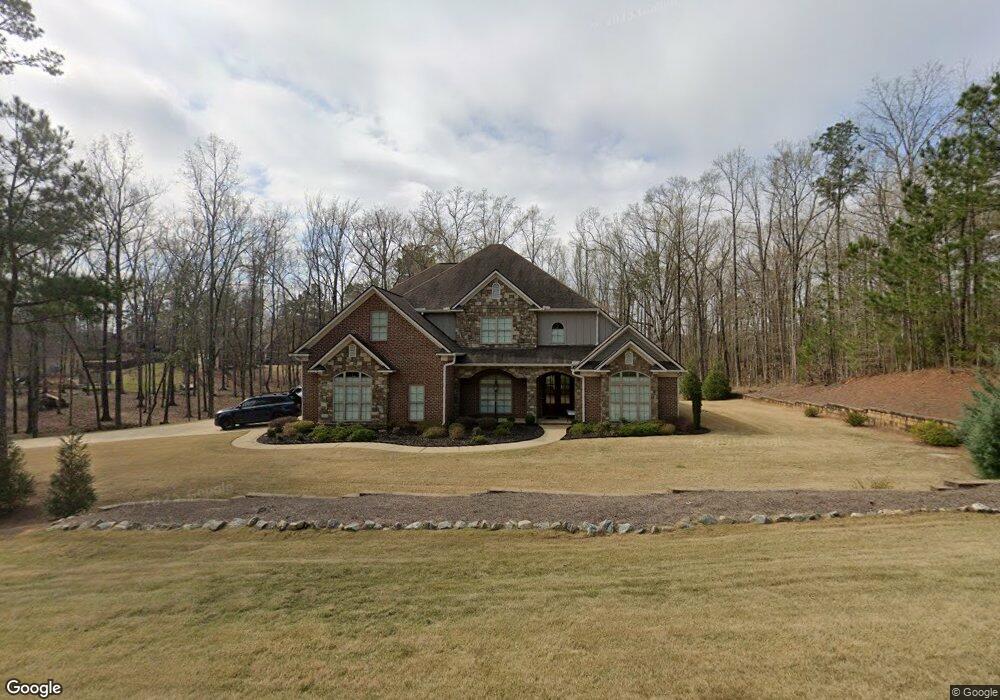
42 Hackberry Ln Cataula, GA 31804
Estimated Value: $551,056 - $821,000
5
Beds
4
Baths
4,335
Sq Ft
$151/Sq Ft
Est. Value
About This Home
This home is located at 42 Hackberry Ln, Cataula, GA 31804 and is currently estimated at $654,264, approximately $150 per square foot. 42 Hackberry Ln is a home located in Harris County with nearby schools including Mulberry Creek Elementary School, Creekside School, and Harris County Carver Middle School.
Ownership History
Date
Name
Owned For
Owner Type
Purchase Details
Closed on
Aug 30, 2019
Sold by
Owen Matthew E
Bought by
Strange John Jerome and Strange Deborah Jean
Current Estimated Value
Home Financials for this Owner
Home Financials are based on the most recent Mortgage that was taken out on this home.
Original Mortgage
$446,512
Outstanding Balance
$389,360
Interest Rate
3.7%
Estimated Equity
$264,904
Purchase Details
Closed on
Jun 1, 2017
Sold by
F
Bought by
Owen Matthew E and Owen Tommie M
Home Financials for this Owner
Home Financials are based on the most recent Mortgage that was taken out on this home.
Original Mortgage
$414,627
Interest Rate
4.02%
Mortgage Type
VA
Purchase Details
Closed on
Jan 5, 2016
Sold by
Parrish Gary W
Bought by
F & M Bank & Trust Co
Purchase Details
Closed on
Mar 6, 2015
Sold by
Harris Developers Inc
Bought by
Parrish Construction Co
Create a Home Valuation Report for This Property
The Home Valuation Report is an in-depth analysis detailing your home's value as well as a comparison with similar homes in the area
Purchase History
| Date | Buyer | Sale Price | Title Company |
|---|---|---|---|
| Strange John Jerome | $490,000 | -- | |
| Owen Matthew E | $430,000 | -- | |
| F & M Bank & Trust Co | -- | -- | |
| Parrish Construction Co | $54,000 | -- |
Source: Public Records
Mortgage History
| Date | Status | Borrower | Loan Amount |
|---|---|---|---|
| Open | Strange John Jerome | $446,512 | |
| Previous Owner | Owen Matthew E | $414,627 |
Source: Public Records
Tax History
| Year | Tax Paid | Tax Assessment Tax Assessment Total Assessment is a certain percentage of the fair market value that is determined by local assessors to be the total taxable value of land and additions on the property. | Land | Improvement |
|---|---|---|---|---|
| 2025 | $6,270 | $213,791 | $22,000 | $191,791 |
| 2024 | $5,503 | $201,065 | $22,000 | $179,065 |
| 2023 | $5,455 | $199,259 | $22,000 | $177,259 |
| 2022 | $5,455 | $199,259 | $22,000 | $177,259 |
| 2021 | $5,528 | $194,611 | $22,000 | $172,611 |
| 2020 | $5,528 | $194,611 | $22,000 | $172,611 |
| 2019 | $4,869 | $181,187 | $22,000 | $159,187 |
| 2018 | $4,720 | $181,187 | $22,000 | $159,187 |
| 2017 | $5,077 | $181,187 | $22,000 | $159,187 |
| 2016 | $3,271 | $132,426 | $22,000 | $110,426 |
| 2015 | $545 | $22,000 | $22,000 | $0 |
| 2014 | $322 | $13,000 | $13,000 | $0 |
| 2013 | -- | $13,000 | $13,000 | $0 |
Source: Public Records
Map
Nearby Homes
- 0 Kennon Dr Unit 1
- 509 Sweetwater Dr
- 508 Sweetwater Dr
- 218 E East Bonacre Rd
- 595 Grey Rock Dr
- 654 Grey Rock Dr
- 654 Grey Rock Rd
- 9807 N Ivy Park Dr
- 492 Mulberry Crossing Dr
- 4555 Mountain Ivy Dr
- 4559 Mountain Ivy Dr
- 172-6 Almond Ridge Dr
- 9214 Granite Field Ct
- 4554 Mountain Ivy Dr
- 4586 Wisteria Ln
- 4677 Ivy Patch Dr
- 303 Waterford Dr
- 8000 Climbing Ivy Ct
- 1278 Jones Rd
- 9586 English Ivy Ct
- 91 Newberry Ln
- 16 Hackberry Ct
- 32 Hackberry Ct
- 35 Hackberry Ln
- 53 Hackberry Ln
- 78 Newberry Ln
- 43 Newberry Ln
- 112 Newberry Ln
- 21 Hackberry Ct
- 42 Newberry Ln
- 81 Hackberry Ln
- 33 Newberry Ln
- 128 Newberry Ln
- 95 Hackberry Ln
- 41 Hackberry Ct
- 20 Newberry Ln
- 98 Hackberry Ln
- 462 Little Bear Dr
- 305 Pinewood Way
- 134 Newberry Ln
Your Personal Tour Guide
Ask me questions while you tour the home.