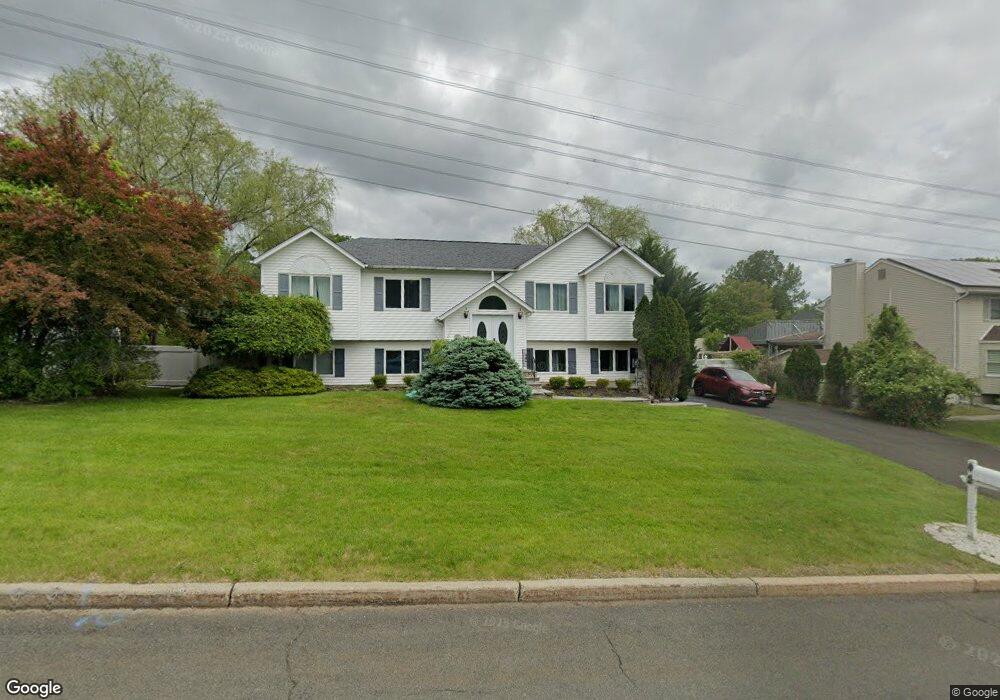
42 Hickory Ln Garnerville, NY 10923
Estimated Value: $840,638 - $1,042,000
6
Beds
3
Baths
2,998
Sq Ft
$306/Sq Ft
Est. Value
About This Home
This home is located at 42 Hickory Ln, Garnerville, NY 10923 and is currently estimated at $916,410, approximately $305 per square foot. 42 Hickory Ln is a home located in Rockland County with nearby schools including Thiells Elementary School, Willow Grove Middle School, and Fieldstone Secondary School.
Ownership History
Date
Name
Owned For
Owner Type
Purchase Details
Closed on
Nov 19, 2021
Sold by
Emerant Lisa and Emerant Marc
Bought by
Oh So Jazzy Llc
Current Estimated Value
Purchase Details
Closed on
Jul 31, 2009
Sold by
Rosario Jeanne
Bought by
Emerant Marc Arthy and Emerant Lisa
Home Financials for this Owner
Home Financials are based on the most recent Mortgage that was taken out on this home.
Original Mortgage
$402,573
Interest Rate
5.47%
Mortgage Type
FHA
Purchase Details
Closed on
Jun 6, 1997
Sold by
Desbiens William H and Desbiens Mildred E
Bought by
Desbiens Mildred E
Purchase Details
Closed on
Aug 21, 1995
Sold by
Joy Builders Inc
Bought by
Rosario Jean
Home Financials for this Owner
Home Financials are based on the most recent Mortgage that was taken out on this home.
Original Mortgage
$150,000
Interest Rate
7.32%
Mortgage Type
Construction
Create a Home Valuation Report for This Property
The Home Valuation Report is an in-depth analysis detailing your home's value as well as a comparison with similar homes in the area
Home Values in the Area
Average Home Value in this Area
Purchase History
| Date | Buyer | Sale Price | Title Company |
|---|---|---|---|
| Oh So Jazzy Llc | -- | Judicial Title | |
| Emerant Marc Arthy | $410,000 | Kevin Russo | |
| Emerant Marc Arthy | $410,000 | National Granite Title Insur | |
| Desbiens Mildred E | -- | Commonwealth Land Title Ins | |
| Rosario Jean | $205,000 | Chicago Title |
Source: Public Records
Mortgage History
| Date | Status | Borrower | Loan Amount |
|---|---|---|---|
| Previous Owner | Emerant Marc Arthy | $402,573 | |
| Previous Owner | Rosario Jean | $150,000 |
Source: Public Records
Tax History Compared to Growth
Tax History
| Year | Tax Paid | Tax Assessment Tax Assessment Total Assessment is a certain percentage of the fair market value that is determined by local assessors to be the total taxable value of land and additions on the property. | Land | Improvement |
|---|---|---|---|---|
| 2024 | $25,177 | $330,100 | $125,000 | $205,100 |
| 2023 | $25,177 | $330,100 | $125,000 | $205,100 |
| 2022 | $24,905 | $330,100 | $125,000 | $205,100 |
| 2021 | $24,905 | $330,100 | $125,000 | $205,100 |
| 2020 | $14,655 | $330,100 | $125,000 | $205,100 |
| 2019 | $4,598 | $330,100 | $125,000 | $205,100 |
| 2018 | $14,283 | $330,100 | $125,000 | $205,100 |
| 2017 | $13,395 | $330,100 | $125,000 | $205,100 |
| 2016 | $13,368 | $330,100 | $125,000 | $205,100 |
| 2015 | -- | $330,100 | $125,000 | $205,100 |
| 2014 | -- | $330,100 | $125,000 | $205,100 |
Source: Public Records
Map
Nearby Homes
- 11 Rockridge Dr
- 27 Ossman Dr
- 15 Woodridge Dr
- 11 Gleason Dr
- 20 Crystal Hill Dr
- 12 Gleason Dr
- 21 Nytko Dr
- 74 Crystal Hill Dr
- 49 Phyllis Dr
- 117 Buckingham Ct Unit 117
- 334 Richard Ct
- 332 Richard Ct Unit 33B
- 505 Country Club Ln Unit 505
- 23 Elm St
- 252 Country Club Ln Unit 252
- 399 Skyline Dr
- 262 Country Club Ln Unit 262
- 174 Country Club Ln
- 82 Parkway Trailer Ct
- 146 Country Club Ln Unit 146