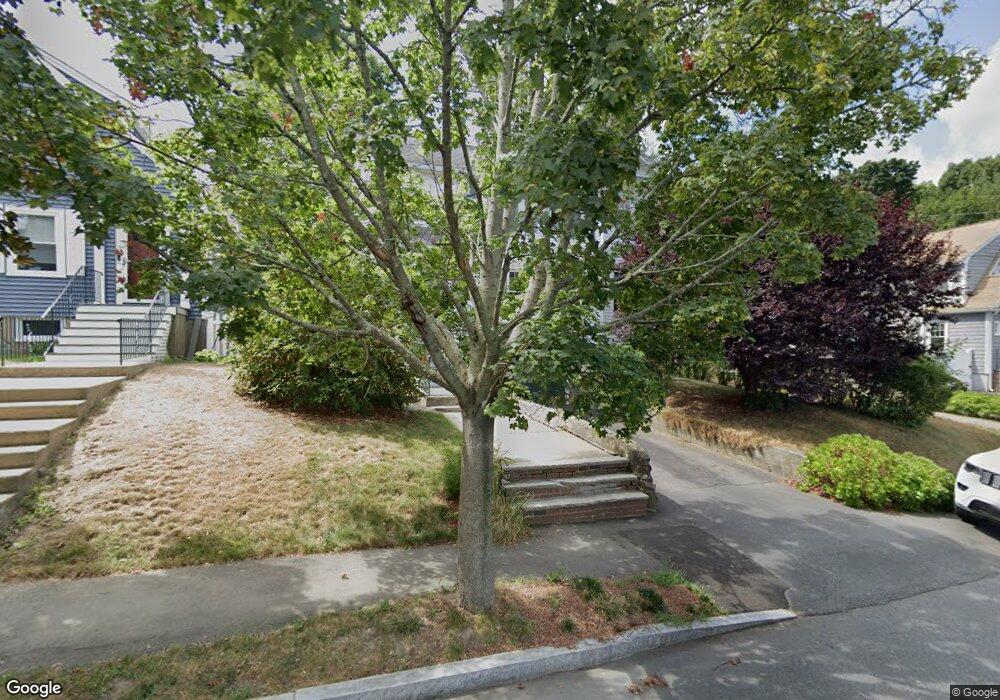
42 Hilltop St Quincy, MA 02169
Quincy Center NeighborhoodEstimated Value: $706,170 - $737,000
3
Beds
2
Baths
1,624
Sq Ft
$444/Sq Ft
Est. Value
About This Home
This home is located at 42 Hilltop St, Quincy, MA 02169 and is currently estimated at $721,043, approximately $443 per square foot. 42 Hilltop St is a home located in Norfolk County with nearby schools including Charles A. Bernazzani Elementary School, Central Middle School, and Quincy High School.
Ownership History
Date
Name
Owned For
Owner Type
Purchase Details
Closed on
Jan 27, 1995
Sold by
Desmond Michael J and Desmond Barbara E
Bought by
Mcgillicuddy Jennifer and Mcgillicuddy Jeffrey P
Current Estimated Value
Purchase Details
Closed on
Apr 30, 1992
Sold by
Goodyear Ann
Bought by
Desmond Michael J and Desmond Barbara E
Create a Home Valuation Report for This Property
The Home Valuation Report is an in-depth analysis detailing your home's value as well as a comparison with similar homes in the area
Home Values in the Area
Average Home Value in this Area
Purchase History
| Date | Buyer | Sale Price | Title Company |
|---|---|---|---|
| Mcgillicuddy Jennifer | $156,000 | -- | |
| Desmond Michael J | $135,000 | -- |
Source: Public Records
Mortgage History
| Date | Status | Borrower | Loan Amount |
|---|---|---|---|
| Open | Desmond Michael J | $184,000 | |
| Closed | Desmond Michael J | $144,700 |
Source: Public Records
Tax History Compared to Growth
Tax History
| Year | Tax Paid | Tax Assessment Tax Assessment Total Assessment is a certain percentage of the fair market value that is determined by local assessors to be the total taxable value of land and additions on the property. | Land | Improvement |
|---|---|---|---|---|
| 2025 | $6,855 | $594,500 | $264,300 | $330,200 |
| 2024 | $6,483 | $575,200 | $251,700 | $323,500 |
| 2023 | $6,015 | $540,400 | $239,700 | $300,700 |
| 2022 | $5,661 | $472,500 | $191,700 | $280,800 |
| 2021 | $5,611 | $462,200 | $191,700 | $270,500 |
| 2020 | $5,438 | $437,500 | $191,700 | $245,800 |
| 2019 | $5,114 | $407,500 | $186,200 | $221,300 |
| 2018 | $5,072 | $380,200 | $172,400 | $207,800 |
| 2017 | $4,998 | $352,700 | $164,200 | $188,500 |
| 2016 | $4,676 | $325,600 | $149,200 | $176,400 |
| 2015 | $4,418 | $302,600 | $140,800 | $161,800 |
| 2014 | $4,309 | $290,000 | $140,800 | $149,200 |
Source: Public Records
Map
Nearby Homes
- 73 Connell St
- 10 White St
- 25 Carrolls Ln
- 1 Cityview Ln Unit 506
- 1 Cityview Ln Unit 210
- 1 Cityview Ln Unit 709
- 89 Puritan Dr
- 41 Wallace Rd
- 211 Copeland St
- 121 Hillside Ave
- 60 Pond St
- 66 Unity St
- 11 Rockwell Ave
- 46 Suomi Rd
- 46 Suomi Rd Unit 46
- 171 Milton St
- 169 Pine St
- 46-48 Buckley St
- 57 Buckley St
- 29 Oconnell Ave