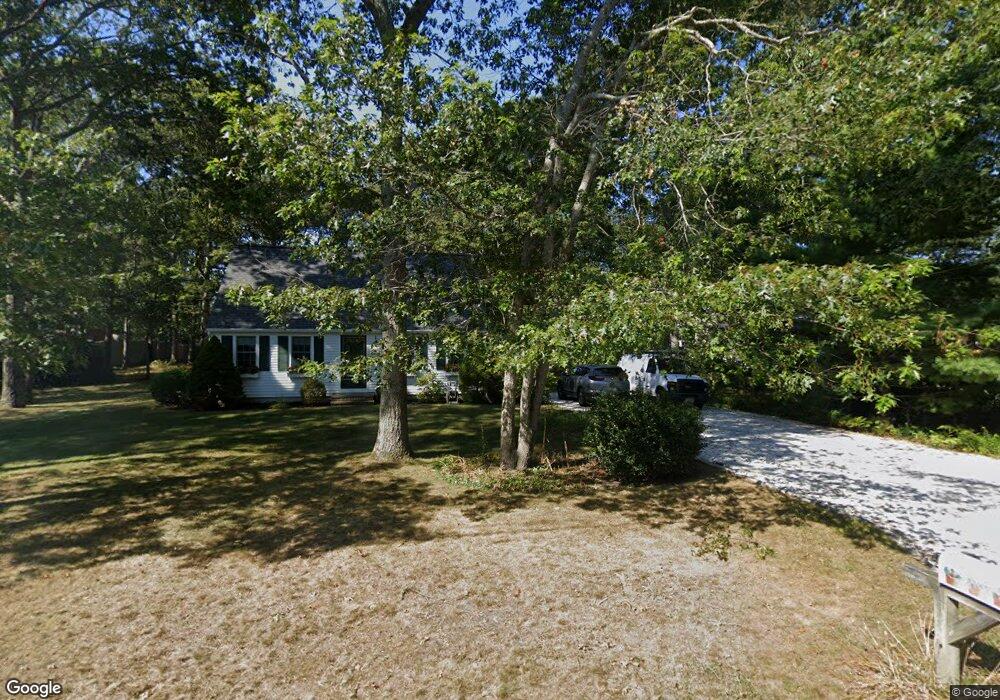
42 Kerry Dr Marstons Mills, MA 02648
Marstons Mills NeighborhoodEstimated Value: $526,000 - $617,000
4
Beds
2
Baths
1,001
Sq Ft
$576/Sq Ft
Est. Value
About This Home
This home is located at 42 Kerry Dr, Marstons Mills, MA 02648 and is currently estimated at $576,367, approximately $575 per square foot. 42 Kerry Dr is a home located in Barnstable County with nearby schools including West Villages Elementary School, Barnstable United Elementary School, and Barnstable Intermediate School.
Ownership History
Date
Name
Owned For
Owner Type
Purchase Details
Closed on
Jan 3, 2025
Sold by
Baker Brian D and Baker Allyson E
Bought by
42 Kerry Rt and Baker
Current Estimated Value
Purchase Details
Closed on
Apr 24, 1998
Sold by
Clifford Richard W
Bought by
Baker Brian D and Baker Allyson E
Home Financials for this Owner
Home Financials are based on the most recent Mortgage that was taken out on this home.
Original Mortgage
$107,000
Interest Rate
7.11%
Mortgage Type
Purchase Money Mortgage
Create a Home Valuation Report for This Property
The Home Valuation Report is an in-depth analysis detailing your home's value as well as a comparison with similar homes in the area
Home Values in the Area
Average Home Value in this Area
Purchase History
| Date | Buyer | Sale Price | Title Company |
|---|---|---|---|
| 42 Kerry Rt | -- | None Available | |
| Baker Brian D | $117,000 | -- | |
| Baker Brian D | $117,000 | -- |
Source: Public Records
Mortgage History
| Date | Status | Borrower | Loan Amount |
|---|---|---|---|
| Previous Owner | Baker Brian D | $107,000 | |
| Previous Owner | Baker Brian D | $100,000 |
Source: Public Records
Tax History Compared to Growth
Tax History
| Year | Tax Paid | Tax Assessment Tax Assessment Total Assessment is a certain percentage of the fair market value that is determined by local assessors to be the total taxable value of land and additions on the property. | Land | Improvement |
|---|---|---|---|---|
| 2025 | $4,099 | $506,700 | $156,500 | $350,200 |
| 2024 | $3,803 | $486,900 | $156,500 | $330,400 |
| 2023 | $3,618 | $433,800 | $142,300 | $291,500 |
| 2022 | $3,354 | $347,900 | $105,400 | $242,500 |
| 2021 | $3,278 | $312,500 | $105,400 | $207,100 |
| 2020 | $3,382 | $308,600 | $105,400 | $203,200 |
| 2019 | $3,210 | $284,600 | $105,400 | $179,200 |
| 2018 | $2,402 | $257,200 | $110,900 | $146,300 |
| 2017 | $2,692 | $250,200 | $110,900 | $139,300 |
| 2016 | $2,739 | $251,300 | $112,000 | $139,300 |
| 2015 | $2,660 | $245,200 | $109,600 | $135,600 |
Source: Public Records
Map
Nearby Homes