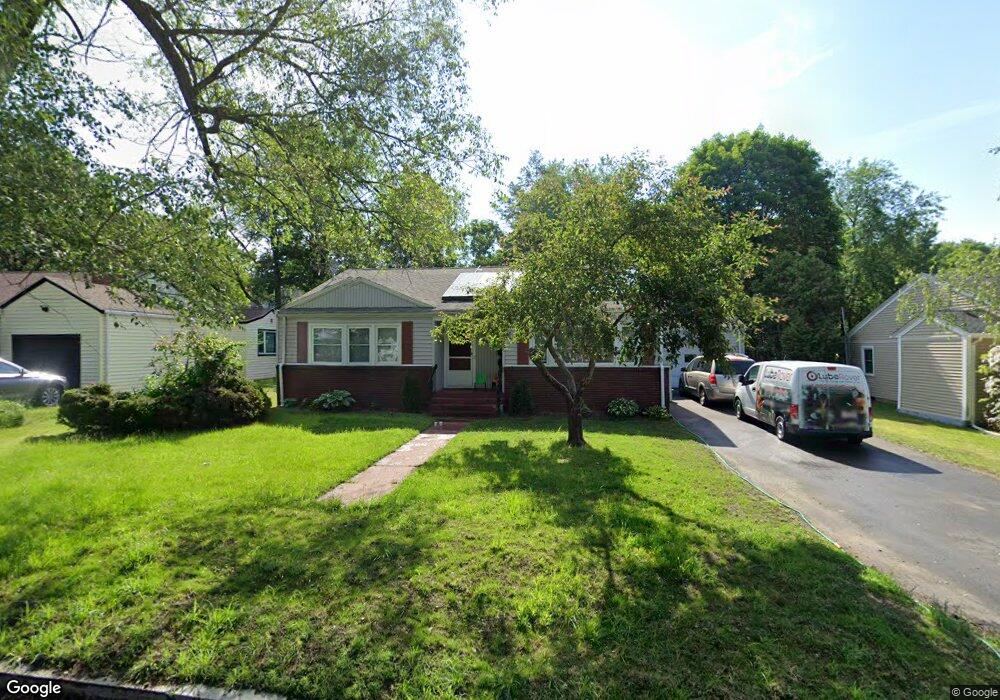
42 Kinnicutt Rd Unit 42 Worcester, MA 01602
Salisbury Street NeighborhoodEstimated Value: $419,000 - $537,000
5
Beds
3
Baths
1,881
Sq Ft
$266/Sq Ft
Est. Value
About This Home
This home is located at 42 Kinnicutt Rd Unit 42, Worcester, MA 01602 and is currently estimated at $500,115, approximately $265 per square foot. 42 Kinnicutt Rd Unit 42 is a home located in Worcester County with nearby schools including Chandler Magnet, Jacob Hiatt Magnet School, and Flagg Street School.
Ownership History
Date
Name
Owned For
Owner Type
Purchase Details
Closed on
Jan 22, 2019
Sold by
Robert Obiageli R
Bought by
Moise Robert Obiageli R and Moise Robert
Current Estimated Value
Purchase Details
Closed on
May 18, 2018
Sold by
Us Bank Na Tr
Bought by
Robert Obiageli R
Home Financials for this Owner
Home Financials are based on the most recent Mortgage that was taken out on this home.
Original Mortgage
$210,894
Interest Rate
5.12%
Mortgage Type
FHA
Purchase Details
Closed on
Aug 14, 2017
Sold by
Aharon-Georgevich Nancy
Bought by
Us Bank Na Tr
Purchase Details
Closed on
May 5, 2006
Sold by
White Cecile Pamela
Bought by
Aharon-Georgevich Nancy and Georgevich Thomas
Home Financials for this Owner
Home Financials are based on the most recent Mortgage that was taken out on this home.
Original Mortgage
$232,000
Interest Rate
6.34%
Mortgage Type
Purchase Money Mortgage
Create a Home Valuation Report for This Property
The Home Valuation Report is an in-depth analysis detailing your home's value as well as a comparison with similar homes in the area
Home Values in the Area
Average Home Value in this Area
Purchase History
| Date | Buyer | Sale Price | Title Company |
|---|---|---|---|
| Moise Robert Obiageli R | -- | -- | |
| Robert Obiageli R | $205,250 | -- | |
| Us Bank Na Tr | $178,912 | -- | |
| Aharon-Georgevich Nancy | $290,000 | -- |
Source: Public Records
Mortgage History
| Date | Status | Borrower | Loan Amount |
|---|---|---|---|
| Previous Owner | Robert Obiageli R | $210,894 | |
| Previous Owner | Aharon-Georgevich Nancy | $232,000 |
Source: Public Records
Tax History Compared to Growth
Tax History
| Year | Tax Paid | Tax Assessment Tax Assessment Total Assessment is a certain percentage of the fair market value that is determined by local assessors to be the total taxable value of land and additions on the property. | Land | Improvement |
|---|---|---|---|---|
| 2025 | $5,860 | $444,300 | $118,600 | $325,700 |
| 2024 | $5,705 | $414,900 | $118,600 | $296,300 |
| 2023 | $5,540 | $386,300 | $103,100 | $283,200 |
| 2022 | $4,917 | $323,300 | $82,500 | $240,800 |
| 2021 | $5,027 | $308,800 | $66,000 | $242,800 |
| 2020 | $4,886 | $287,400 | $66,000 | $221,400 |
| 2019 | $4,581 | $254,500 | $59,400 | $195,100 |
| 2018 | $4,406 | $233,000 | $59,400 | $173,600 |
| 2017 | $4,478 | $233,000 | $59,400 | $173,600 |
| 2016 | $4,450 | $215,900 | $43,500 | $172,400 |
| 2015 | $4,333 | $215,900 | $43,500 | $172,400 |
| 2014 | $4,221 | $216,000 | $43,500 | $172,500 |
Source: Public Records
Map
Nearby Homes
- 42 Kinnicutt Rd
- 40 Kinnicutt Rd
- 44 Kinnicutt Rd
- 35 Chippewa Rd
- 37 Chippewa Rd
- 46 Westbrook Rd
- 38 Kinnicutt Rd
- 33 Chippewa Rd
- 43 Kinnicutt Rd
- 39 Chippewa Rd
- 45 Kinnicutt Rd
- 36 Kinnicutt Rd
- 41 Kinnicutt Rd
- 38 Westbrook Rd
- 50 Kinnicutt Rd
- 31 Chippewa Rd
- 34 Kinnicutt Rd
- 37 Kinnicutt Rd
- 36 Chippewa Rd
- 38 Chippewa Rd