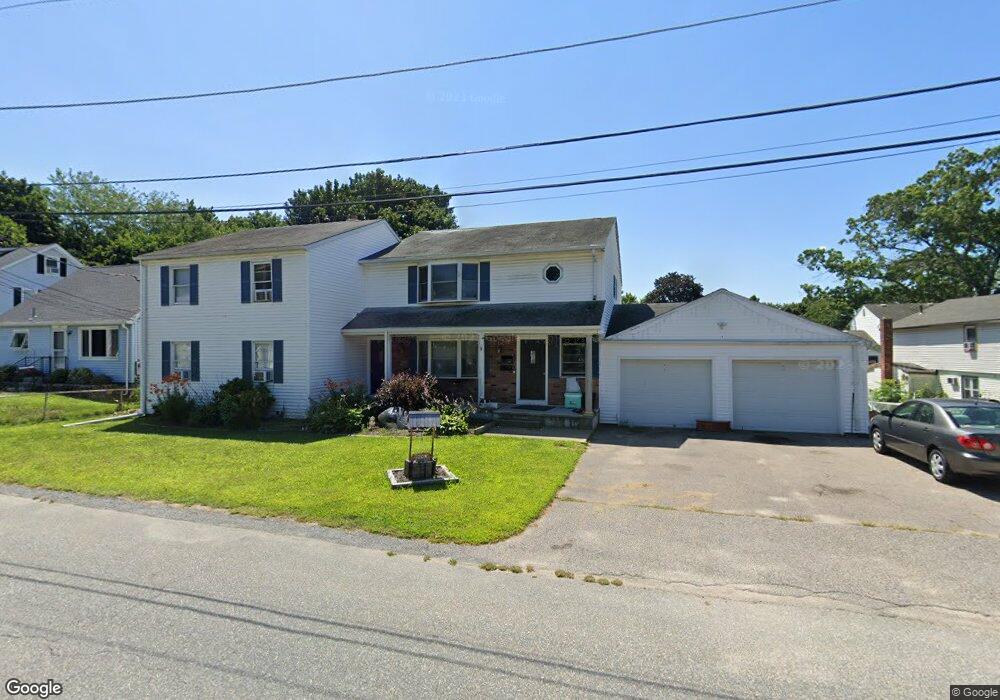
42 Larch St Woonsocket, RI 02895
East Woonsocket NeighborhoodEstimated Value: $520,000 - $596,852
6
Beds
2
Baths
3,144
Sq Ft
$178/Sq Ft
Est. Value
About This Home
This home is located at 42 Larch St, Woonsocket, RI 02895 and is currently estimated at $558,713, approximately $177 per square foot. 42 Larch St is a home located in Providence County with nearby schools including Woonsocket High School, Blackstone Valley Prep Element, and Blackstone Valley Prep High School.
Ownership History
Date
Name
Owned For
Owner Type
Purchase Details
Closed on
Sep 2, 2021
Sold by
Allard Pauline T Est and Allard-Noreau
Bought by
Silva Michelle
Current Estimated Value
Purchase Details
Closed on
Mar 5, 2012
Sold by
Allard Pauline T and Allard Eva M
Bought by
Allard Pauline T
Create a Home Valuation Report for This Property
The Home Valuation Report is an in-depth analysis detailing your home's value as well as a comparison with similar homes in the area
Home Values in the Area
Average Home Value in this Area
Purchase History
| Date | Buyer | Sale Price | Title Company |
|---|---|---|---|
| Silva Michelle | $270,365 | None Available | |
| Silva Michelle | $270,365 | None Available | |
| Silva Michelle | $270,365 | None Available | |
| Allard Pauline T | -- | -- | |
| Allard Pauline T | -- | -- |
Source: Public Records
Mortgage History
| Date | Status | Borrower | Loan Amount |
|---|---|---|---|
| Previous Owner | Allard Pauline T | $367,500 | |
| Previous Owner | Allard Pauline T | $20,200 | |
| Previous Owner | Allard Pauline T | $103,000 |
Source: Public Records
Tax History
| Year | Tax Paid | Tax Assessment Tax Assessment Total Assessment is a certain percentage of the fair market value that is determined by local assessors to be the total taxable value of land and additions on the property. | Land | Improvement |
|---|---|---|---|---|
| 2025 | $6,994 | $622,800 | $107,900 | $514,900 |
| 2024 | $5,399 | $371,300 | $88,000 | $283,300 |
| 2023 | $5,191 | $371,300 | $88,000 | $283,300 |
| 2022 | $5,191 | $371,300 | $88,000 | $283,300 |
| 2021 | $4,992 | $210,200 | $70,700 | $139,500 |
| 2020 | $5,045 | $210,200 | $70,700 | $139,500 |
| 2018 | $5,062 | $210,200 | $70,700 | $139,500 |
| 2017 | $5,791 | $192,400 | $65,300 | $127,100 |
| 2016 | $6,126 | $192,400 | $65,300 | $127,100 |
| 2015 | $7,038 | $192,400 | $65,300 | $127,100 |
| 2014 | $6,201 | $189,600 | $71,900 | $117,700 |
Source: Public Records
Map
Nearby Homes
- 202 Phillips St
- 39 Louise St
- 49 Poisson St
- 3 Quail St
- 3889 Mendon Rd
- 42 Armand Ave
- 45 Valley View Dr
- 19 Marques St
- 252 Railroad St
- 86 Branch Ave
- 378 Gauthier Dr
- 216 Bertenshaw Rd
- 414 Rhode Island Ave
- 375 Congress St
- 253 Central St
- 0 Hillview St
- 1 Bouvier Ave
- 20 Mount Pleasant View Ave
- 68 Kenwood St
- 200 Manville Hill Unit 41 Bldg B Rd Unit 41
Your Personal Tour Guide
Ask me questions while you tour the home.