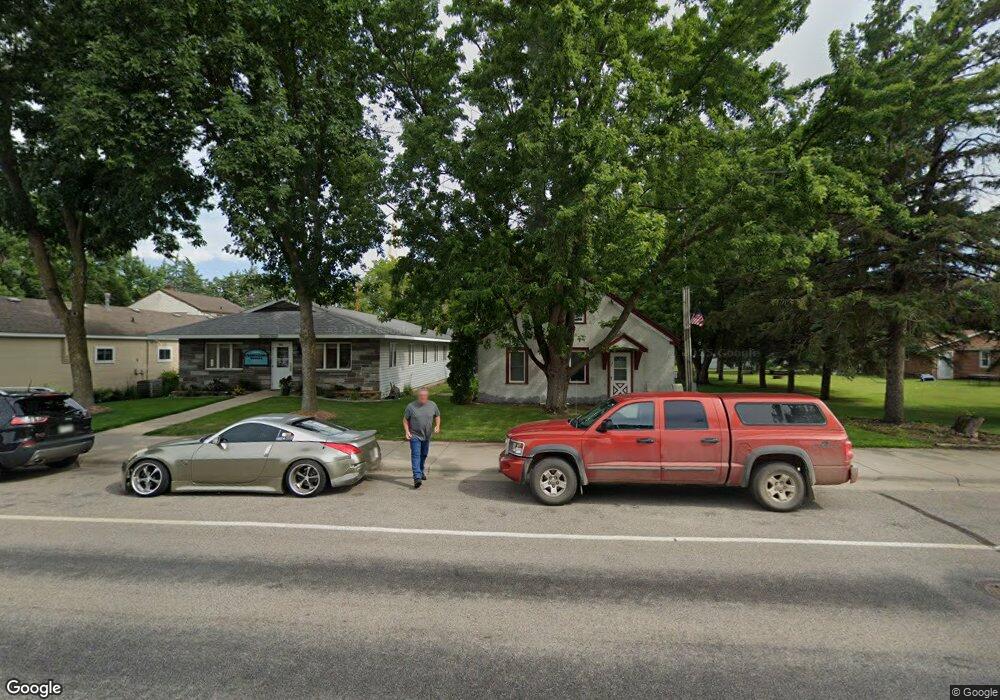
42 Main St E Richmond, MN 56368
Estimated Value: $185,824 - $238,000
3
Beds
1
Bath
1,134
Sq Ft
$177/Sq Ft
Est. Value
About This Home
This home is located at 42 Main St E, Richmond, MN 56368 and is currently estimated at $201,206, approximately $177 per square foot. 42 Main St E is a home located in Stearns County with nearby schools including Rocori Senior High School, Saints Peter & Paul Catholic School, and Dei Spring Academy.
Ownership History
Date
Name
Owned For
Owner Type
Purchase Details
Closed on
Dec 6, 2024
Sold by
Bruemmer Judy and Bruemmer Gilbert
Bought by
Stang Devin K
Current Estimated Value
Home Financials for this Owner
Home Financials are based on the most recent Mortgage that was taken out on this home.
Original Mortgage
$151,805
Outstanding Balance
$150,409
Interest Rate
6.54%
Mortgage Type
New Conventional
Estimated Equity
$50,797
Purchase Details
Closed on
Dec 2, 2024
Sold by
Bruemmer Judy and Bruemmer Gilbert
Bought by
Stang Devin
Home Financials for this Owner
Home Financials are based on the most recent Mortgage that was taken out on this home.
Original Mortgage
$151,805
Outstanding Balance
$150,409
Interest Rate
6.54%
Mortgage Type
New Conventional
Estimated Equity
$50,797
Purchase Details
Closed on
Sep 30, 2011
Sold by
Pivec Marcella B
Bought by
Bruemmer Roger S
Purchase Details
Closed on
Jul 30, 1999
Sold by
Schouviller Mark
Bought by
Pivec Marcella
Purchase Details
Closed on
Jan 15, 1994
Sold by
Butala Russell and Butala Sandra
Bought by
Schouviller Mark
Create a Home Valuation Report for This Property
The Home Valuation Report is an in-depth analysis detailing your home's value as well as a comparison with similar homes in the area
Purchase History
| Date | Buyer | Sale Price | Title Company |
|---|---|---|---|
| Stang Devin K | $156,500 | First American Title | |
| Stang Devin | $156,500 | -- | |
| Bruemmer Roger S | $89,900 | -- | |
| Pivec Marcella | $77,500 | -- | |
| Schouviller Mark | $41,000 | -- |
Source: Public Records
Mortgage History
| Date | Status | Borrower | Loan Amount |
|---|---|---|---|
| Open | Stang Devin K | $151,805 | |
| Closed | Stang Devin | $155,500 |
Source: Public Records
Tax History
| Year | Tax Paid | Tax Assessment Tax Assessment Total Assessment is a certain percentage of the fair market value that is determined by local assessors to be the total taxable value of land and additions on the property. | Land | Improvement |
|---|---|---|---|---|
| 2025 | $1,370 | $148,000 | $19,000 | $129,000 |
| 2024 | $1,370 | $135,000 | $19,000 | $116,000 |
| 2023 | $1,262 | $122,400 | $17,500 | $104,900 |
| 2022 | $1,134 | $101,000 | $16,000 | $85,000 |
| 2021 | $1,132 | $101,000 | $16,000 | $85,000 |
| 2020 | $1,962 | $100,100 | $16,000 | $84,100 |
| 2019 | $1,870 | $98,200 | $14,800 | $83,400 |
| 2018 | $1,836 | $87,500 | $13,800 | $73,700 |
| 2017 | $1,750 | $81,400 | $13,800 | $67,600 |
| 2016 | $1,736 | $0 | $0 | $0 |
| 2015 | $1,670 | $0 | $0 | $0 |
| 2014 | -- | $0 | $0 | $0 |
Source: Public Records
Map
Nearby Homes
- 148 Main St W
- 107 Barry Loop NW
- 101 Barry Loop NW
- 724 4th St NW
- 22579 Fordham Rd
- 20611 Becker Lake Cir
- 20643 217th St
- 22918 Turtle Creek Cir
- 17473 Fairway Cir
- 20556 Elkview Rd
- 20404 Elkview Rd
- 22225 Big Lake Ct
- 803 Kray's Lake Rd
- 812 Kray's Lake Rd
- 807 Kray's Lake Rd
- 904 Kray's Lake Rd
- 2004 River Links Dr
- 1914 River Links Dr
- 1912 River Links Dr
- 1609 1st St N
- 27 Ivy Ave NE
- 30 Central Ave N
- 10 Main St E
- 45 1st St NE
- 29 1st St NE
- 64 Central Ave N
- 57 Ivy Ave NE
- 43 Main St W
- 104 104 Main-Street-e
- 34 Ivy Ave NE
- 21 Ivy Ave SE
- 62 Central Ave N
- 12 Main St W
- 45 Central Ave N
- 109 Main St E
- 120 Main St E
- 109 109 Main-Street-e
- 58 Ivy Ave NE
- 28 Main St W Unit 2
- 61 Central Ave N
Your Personal Tour Guide
Ask me questions while you tour the home.