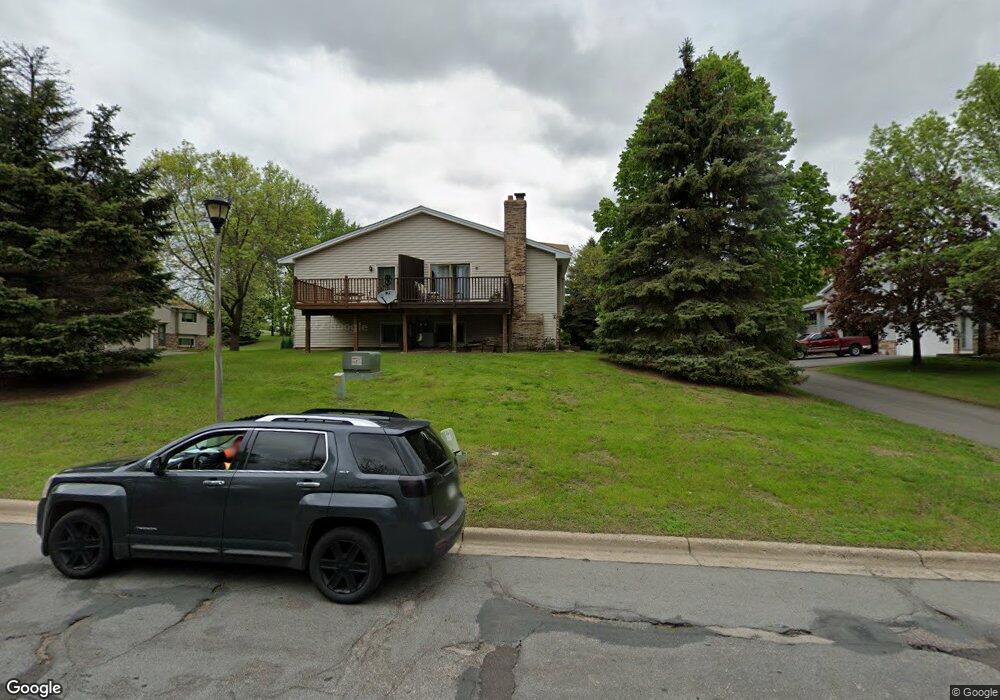
42 Maple Island Rd Burnsville, MN 55306
Estimated Value: $232,000 - $298,000
3
Beds
2
Baths
938
Sq Ft
$277/Sq Ft
Est. Value
About This Home
This home is located at 42 Maple Island Rd, Burnsville, MN 55306 and is currently estimated at $260,232, approximately $277 per square foot. 42 Maple Island Rd is a home located in Dakota County with nearby schools including Oak Hills Elementary School, Kenwood Trail Middle School, and Lakeville North High School.
Ownership History
Date
Name
Owned For
Owner Type
Purchase Details
Closed on
Sep 17, 2015
Sold by
1804 Ventures Inc
Bought by
Williams Erwin
Current Estimated Value
Home Financials for this Owner
Home Financials are based on the most recent Mortgage that was taken out on this home.
Original Mortgage
$6,000
Outstanding Balance
$4,738
Interest Rate
3.91%
Mortgage Type
Negative Amortization
Estimated Equity
$255,494
Purchase Details
Closed on
Oct 1, 2014
Sold by
Hilstrom Robert G
Bought by
Wells Fargo Bank Na
Purchase Details
Closed on
Aug 1, 2005
Sold by
Stark Patrick M
Bought by
Hilstrom Robert
Purchase Details
Closed on
Nov 18, 2002
Sold by
Stark Mylon L and Stark Barbara A
Bought by
Stark Patrick M
Purchase Details
Closed on
Jun 29, 2001
Sold by
Nedelcoff Shirley
Bought by
Stark Mylon L and Stark Barbara A
Create a Home Valuation Report for This Property
The Home Valuation Report is an in-depth analysis detailing your home's value as well as a comparison with similar homes in the area
Home Values in the Area
Average Home Value in this Area
Purchase History
| Date | Buyer | Sale Price | Title Company |
|---|---|---|---|
| Williams Erwin | $153,500 | Titlenexus Llc | |
| Wells Fargo Bank Na | $97,515 | None Available | |
| Hilstrom Robert | $177,500 | -- | |
| Stark Patrick M | $163,000 | -- | |
| Stark Mylon L | $143,000 | -- |
Source: Public Records
Mortgage History
| Date | Status | Borrower | Loan Amount |
|---|---|---|---|
| Open | Williams Erwin | $6,000 | |
| Previous Owner | Williams Erwin | $150,719 |
Source: Public Records
Tax History Compared to Growth
Tax History
| Year | Tax Paid | Tax Assessment Tax Assessment Total Assessment is a certain percentage of the fair market value that is determined by local assessors to be the total taxable value of land and additions on the property. | Land | Improvement |
|---|---|---|---|---|
| 2024 | $2,600 | $221,100 | $37,000 | $184,100 |
| 2023 | $2,600 | $210,600 | $37,100 | $173,500 |
| 2022 | $2,188 | $204,700 | $37,000 | $167,700 |
| 2021 | $2,168 | $171,400 | $32,200 | $139,200 |
| 2020 | $2,286 | $166,500 | $30,700 | $135,800 |
| 2019 | $1,751 | $165,800 | $29,200 | $136,600 |
| 2018 | $1,506 | $150,300 | $27,000 | $123,300 |
| 2017 | $1,525 | $132,100 | $25,000 | $107,100 |
| 2016 | $1,426 | $131,000 | $23,800 | $107,200 |
| 2015 | $1,873 | $93,996 | $18,034 | $75,962 |
| 2014 | -- | $81,352 | $16,226 | $65,126 |
| 2013 | -- | $65,220 | $13,391 | $51,829 |
Source: Public Records
Map
Nearby Homes
- 16045 Oak Shore Dr
- 101 Oak Shore Dr
- 10435 163rd St W
- 1005 Hilloway Cir
- 16357 Java Ln
- 313 Maple Island Rd
- 16365 Javari Ct
- 16344 Jatos Cir
- 333 Maple Island Rd
- 9955 161st St W
- 594 Stonewood Ln
- 15455 Fremont Ave S
- 15250 Stevens Ave
- 1312 Fremont Ct
- 344 Stonewood Place
- 16415 Jaffna Place
- 16386 Jaffna Place
- 600 Greenhaven Dr Unit 213
- 15100 Eileen Cir
- 15203 Greenhaven Way
- 40 Maple Island Rd
- 48 Maple Island Rd
- 44 Maple Island Rd
- 34 Maple Island Rd
- 50 Maple Island Rd
- 38 Maple Island Rd
- 46 Maple Island Rd
- 36 Maple Island Rd
- 52 Maple Island Rd
- 32 Maple Island Rd
- 56 Maple Island Rd
- 30 Maple Island Rd
- 54 Maple Island Rd
- 26 Maple Island Rd
- 29 Maple Island Rd
- 28 Maple Island Rd
- 25 Maple Island Rd
- 27 Maple Island Rd
- 21 Maple Island Rd
- 24 Maple Island Rd