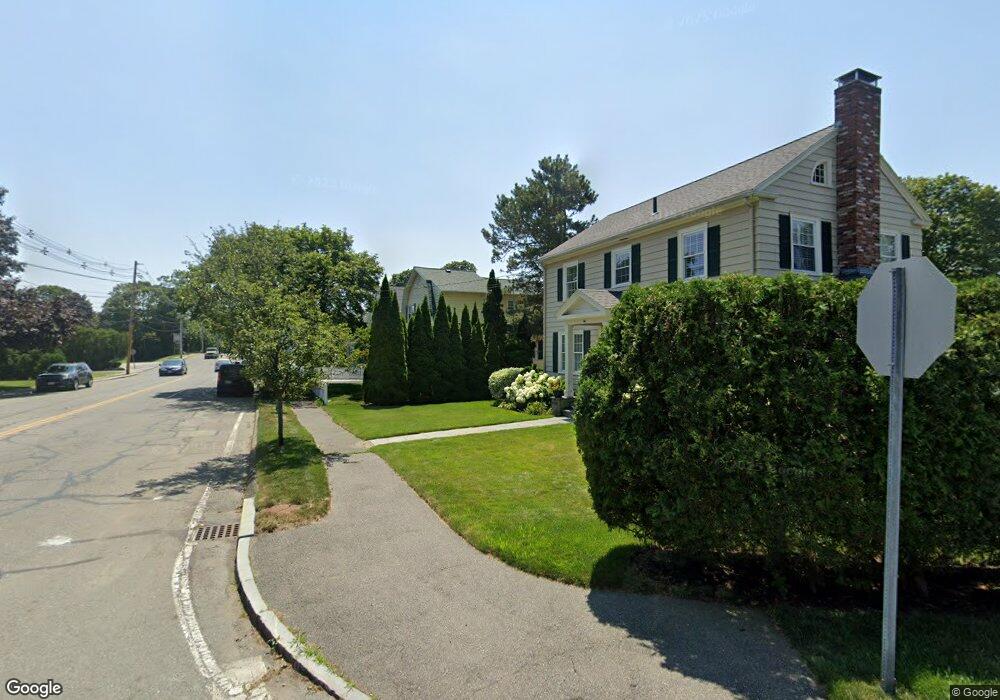
42 Maple St Marblehead, MA 01945
Estimated Value: $815,000 - $1,014,000
3
Beds
3
Baths
1,823
Sq Ft
$481/Sq Ft
Est. Value
About This Home
This home is located at 42 Maple St, Marblehead, MA 01945 and is currently estimated at $877,406, approximately $481 per square foot. 42 Maple St is a home located in Essex County with nearby schools including Marblehead High School, Tower School, and Devereux School.
Ownership History
Date
Name
Owned For
Owner Type
Purchase Details
Closed on
Jan 27, 2005
Sold by
Shay Anne Marie and Shay James M
Bought by
Reilly Terence P
Current Estimated Value
Home Financials for this Owner
Home Financials are based on the most recent Mortgage that was taken out on this home.
Original Mortgage
$175,000
Interest Rate
5.67%
Mortgage Type
Purchase Money Mortgage
Create a Home Valuation Report for This Property
The Home Valuation Report is an in-depth analysis detailing your home's value as well as a comparison with similar homes in the area
Home Values in the Area
Average Home Value in this Area
Purchase History
| Date | Buyer | Sale Price | Title Company |
|---|---|---|---|
| Reilly Terence P | $432,500 | -- | |
| Reilly Terence P | $432,500 | -- |
Source: Public Records
Mortgage History
| Date | Status | Borrower | Loan Amount |
|---|---|---|---|
| Open | Reilly Terence P | $190,000 | |
| Closed | Reilly Terence P | $175,000 | |
| Previous Owner | Reilly Terence P | $150,000 |
Source: Public Records
Tax History
| Year | Tax Paid | Tax Assessment Tax Assessment Total Assessment is a certain percentage of the fair market value that is determined by local assessors to be the total taxable value of land and additions on the property. | Land | Improvement |
|---|---|---|---|---|
| 2025 | $6,767 | $747,700 | $465,900 | $281,800 |
| 2024 | $6,197 | $691,600 | $419,300 | $272,300 |
| 2023 | $6,371 | $637,100 | $419,300 | $217,800 |
| 2022 | $5,916 | $562,400 | $349,400 | $213,000 |
| 2021 | $5,585 | $536,000 | $326,100 | $209,900 |
| 2020 | $5,769 | $555,200 | $349,400 | $205,800 |
| 2019 | $5,625 | $523,700 | $326,100 | $197,600 |
| 2018 | $5,387 | $488,800 | $291,200 | $197,600 |
| 2017 | $4,869 | $442,200 | $244,600 | $197,600 |
| 2016 | $4,650 | $418,900 | $221,300 | $197,600 |
| 2015 | $4,816 | $434,700 | $232,900 | $201,800 |
| 2014 | $4,432 | $399,600 | $209,600 | $190,000 |
Source: Public Records
Map
Nearby Homes
- 12 Pickwick Rd
- 4 Dean Rd
- 11 Angenica Terrace
- 33 W Shore Dr
- 212 Humphrey St Unit 205
- 282 Pleasant St
- 48 Bellevue Rd
- 4 Fairview Rd
- 70 Maverick St
- 30 Haley Rd Unit 1
- 106 Broadway Unit 3
- 28 Surrey Rd
- 326 Lafayette St Unit 2
- 23 Marion Rd Unit B
- 24 Wisteria St Unit 2
- 1002 Paradise Rd Unit PHE
- 1 Shore Ave
- 23 Wyman Rd
- 29 Ocean Ave Unit 4
- 1004 Paradise Rd Unit 1L
Your Personal Tour Guide
Ask me questions while you tour the home.