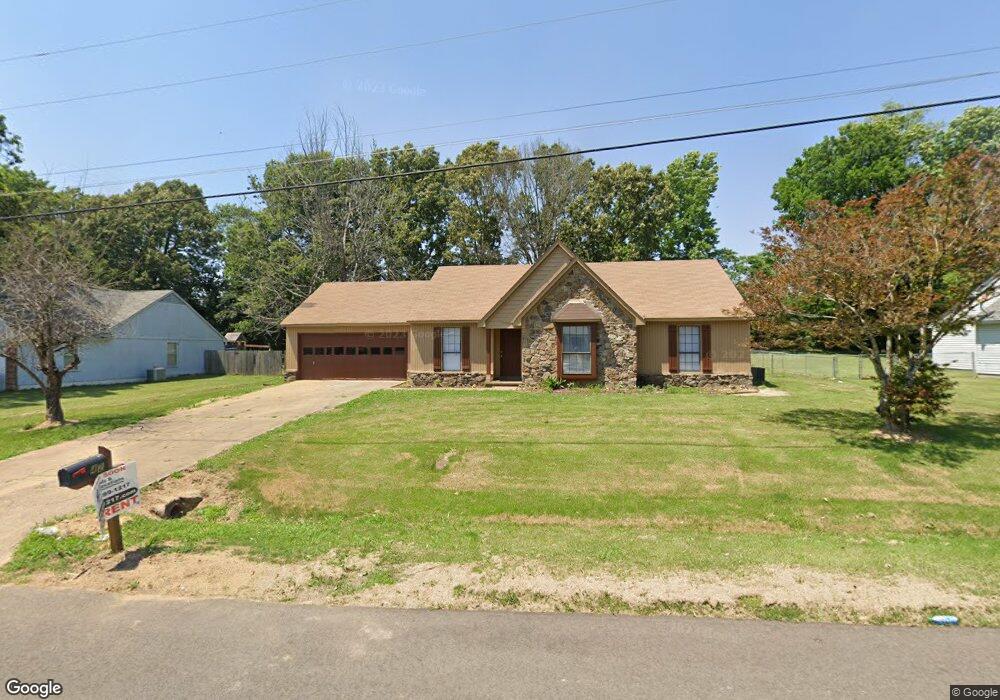
42 McGee Loop Jackson, TN 38305
Estimated Value: $159,000 - $193,000
3
Beds
2
Baths
1,448
Sq Ft
$123/Sq Ft
Est. Value
About This Home
This home is located at 42 McGee Loop, Jackson, TN 38305 and is currently estimated at $177,696, approximately $122 per square foot. 42 McGee Loop is a home located in Madison County with nearby schools including East Elementary School, Northeast Middle School, and North Side High School.
Ownership History
Date
Name
Owned For
Owner Type
Purchase Details
Closed on
Sep 22, 2022
Sold by
Lay Bruce E and Lay Linda
Bought by
Lay Heath Zachary
Current Estimated Value
Purchase Details
Closed on
Sep 28, 2012
Sold by
Secretary Of Housing And U
Bought by
Lay Bruce E and Lay Linda
Purchase Details
Closed on
May 21, 2012
Sold by
Tennessee Housing Developm
Bought by
Secretary Of Housing And Urban and C/O Mcb Oklahoma Mcm Office
Purchase Details
Closed on
May 16, 2012
Sold by
Hixon Crystal L
Bought by
Tennessee Housing Development
Purchase Details
Closed on
Apr 14, 2008
Sold by
Tony Gooch
Bought by
Hixon Crystal L
Purchase Details
Closed on
Sep 25, 2007
Sold by
Washington Mutual Bank
Bought by
Tony Gooch
Purchase Details
Closed on
Aug 9, 2007
Sold by
Patrick Williams William
Bought by
Washington Mutual Bank
Purchase Details
Closed on
Jun 29, 1990
Bought by
Williams William A
Purchase Details
Closed on
Apr 30, 1986
Bought by
Baker Barry L
Purchase Details
Closed on
Jan 9, 1986
Purchase Details
Closed on
Aug 9, 1985
Create a Home Valuation Report for This Property
The Home Valuation Report is an in-depth analysis detailing your home's value as well as a comparison with similar homes in the area
Purchase History
| Date | Buyer | Sale Price | Title Company |
|---|---|---|---|
| Lay Heath Zachary | -- | -- | |
| Lay Bruce E | $63,500 | -- | |
| Secretary Of Housing And Urban | $108,090 | -- | |
| Tennessee Housing Development | $108,090 | -- | |
| Hixon Crystal L | $102,800 | -- | |
| Tony Gooch | $59,000 | -- | |
| Washington Mutual Bank | $83,000 | -- | |
| Williams William A | -- | -- | |
| Baker Barry L | -- | -- | |
| -- | -- | -- | |
| -- | -- | -- |
Source: Public Records
Tax History
| Year | Tax Paid | Tax Assessment Tax Assessment Total Assessment is a certain percentage of the fair market value that is determined by local assessors to be the total taxable value of land and additions on the property. | Land | Improvement |
|---|---|---|---|---|
| 2025 | $700 | $37,350 | $5,000 | $32,350 |
| 2024 | $700 | $37,350 | $5,000 | $32,350 |
| 2022 | $700 | $37,350 | $5,000 | $32,350 |
| 2021 | $492 | $20,950 | $3,150 | $17,800 |
| 2020 | $492 | $20,950 | $3,150 | $17,800 |
| 2019 | $492 | $20,950 | $3,150 | $17,800 |
| 2018 | $492 | $20,950 | $3,150 | $17,800 |
| 2017 | $505 | $20,625 | $3,150 | $17,475 |
| 2016 | $443 | $20,625 | $3,150 | $17,475 |
| 2015 | $443 | $20,625 | $3,150 | $17,475 |
| 2014 | $445 | $20,700 | $3,150 | $17,550 |
Source: Public Records
Map
Nearby Homes
- 24 Palmetto Cove
- 91 McGee Loop
- 99 Hidden Valley Dr
- 0 Interstate 40 Unit 2505648
- 0 Interstate 40
- 0 U S Highway 412
- 111 Henderson Rd
- 21 Bluebird Cove
- 0 Red Gum Ln & Old Medina Crossing Ln Unit 10195533
- 2888 Old Medina Rd
- 189 Valley Oak Loop
- 85 Old Medina Crossing
- 31 Mack St
- 41 International Cove
- 34 Baymeadows Dr
- 20 Bink Dr
- 00 Chloe Place
- 78 Candlewick Dr
- 62 Beth Place
- 339 Parkstone Place
- 50 McGee Loop
- 26 McGee Loop
- 43 McGee Loop
- 51 McGee Loop
- 35 McGee Loop
- 82 Jeremy Dr
- 66 McGee Loop
- 18 McGee Loop
- 27 McGee Loop
- 42 Hidden Valley Dr
- 50 Hidden Valley Dr
- 19 McGee Loop
- 34 Hidden Valley Dr
- 74 McGee Loop
- 10 McGee Loop
- 58 Hidden Valley Dr
- 26 Hidden Valley Dr
- 11 McGee Loop
- 18 Hidden Valley Dr
- 75 McGee Loop
Your Personal Tour Guide
Ask me questions while you tour the home.