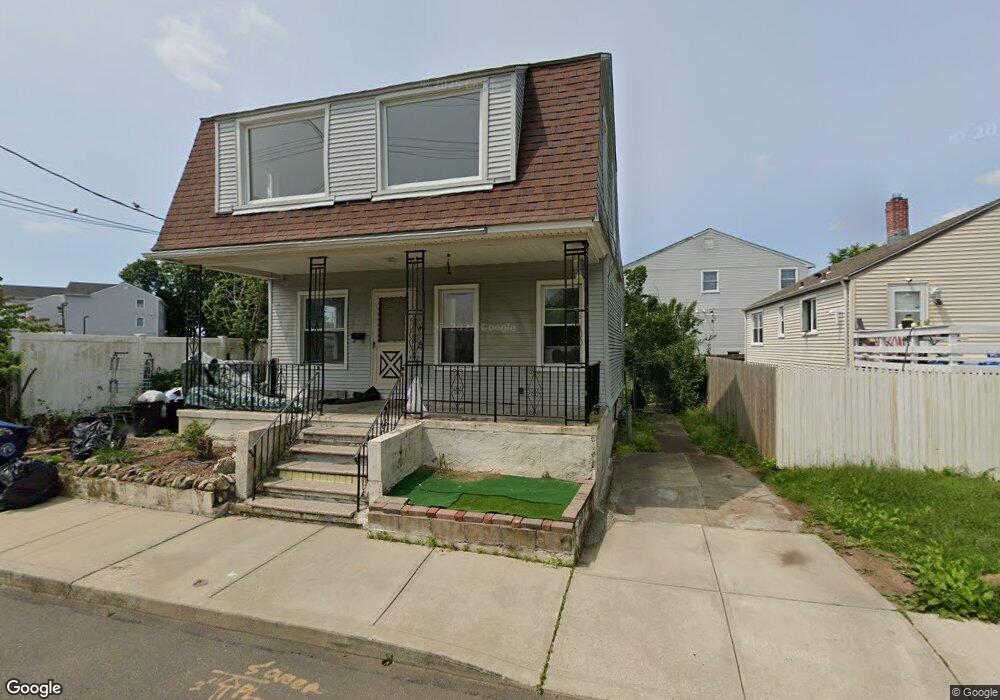
42 Morse Ave West Haven, CT 06516
West Haven Center NeighborhoodEstimated Value: $278,000 - $326,585
2
Beds
2
Baths
1,118
Sq Ft
$273/Sq Ft
Est. Value
About This Home
This home is located at 42 Morse Ave, West Haven, CT 06516 and is currently estimated at $304,896, approximately $272 per square foot. 42 Morse Ave is a home located in New Haven County with nearby schools including Carrigan 5/6 Intermediate School, Harry M. Bailey Middle School, and West Haven High School.
Ownership History
Date
Name
Owned For
Owner Type
Purchase Details
Closed on
Apr 16, 2008
Sold by
Department Of Housing & Urban Dev
Bought by
Tu Duanhua and Feng-Zhang Felicia
Current Estimated Value
Purchase Details
Closed on
Feb 17, 2000
Sold by
First Vision Llc
Bought by
Kasavicha John W
Home Financials for this Owner
Home Financials are based on the most recent Mortgage that was taken out on this home.
Original Mortgage
$105,000
Interest Rate
8.11%
Mortgage Type
Purchase Money Mortgage
Purchase Details
Closed on
Jul 8, 1999
Sold by
Capone Janet
Bought by
First Vision Llc
Create a Home Valuation Report for This Property
The Home Valuation Report is an in-depth analysis detailing your home's value as well as a comparison with similar homes in the area
Home Values in the Area
Average Home Value in this Area
Purchase History
| Date | Buyer | Sale Price | Title Company |
|---|---|---|---|
| Tu Duanhua | $108,098 | -- | |
| Kasavicha John W | $105,000 | -- | |
| First Vision Llc | $50,000 | -- | |
| Tu Duanhua | $108,098 | -- | |
| Kasavicha John W | $105,000 | -- | |
| First Vision Llc | $50,000 | -- |
Source: Public Records
Mortgage History
| Date | Status | Borrower | Loan Amount |
|---|---|---|---|
| Previous Owner | First Vision Llc | $105,000 | |
| Previous Owner | First Vision Llc | $11,000 |
Source: Public Records
Tax History
| Year | Tax Paid | Tax Assessment Tax Assessment Total Assessment is a certain percentage of the fair market value that is determined by local assessors to be the total taxable value of land and additions on the property. | Land | Improvement |
|---|---|---|---|---|
| 2025 | $7,288 | $211,050 | $106,190 | $104,860 |
| 2024 | $6,810 | $140,350 | $73,570 | $66,780 |
| 2023 | $6,528 | $140,350 | $73,570 | $66,780 |
| 2022 | $6,400 | $140,350 | $73,570 | $66,780 |
| 2021 | $6,400 | $140,350 | $73,570 | $66,780 |
| 2020 | $6,356 | $125,930 | $66,780 | $59,150 |
| 2019 | $6,129 | $125,930 | $66,780 | $59,150 |
| 2018 | $6,076 | $125,930 | $66,780 | $59,150 |
| 2017 | $5,750 | $125,930 | $66,780 | $59,150 |
| 2016 | $5,737 | $125,930 | $66,780 | $59,150 |
| 2015 | $5,666 | $140,420 | $74,900 | $65,520 |
| 2014 | $5,631 | $140,420 | $74,900 | $65,520 |
Source: Public Records
Map
Nearby Homes
- 2 Thomas St
- 4 Thomas St
- 8 Thomas St
- 28 Morse Ave
- 7 Thomas St
- 9 Morse Ave Unit 9
- 7 Morse Ave Unit 7
- 5 Morse Ave Unit 5
- 3 Morse Ave Unit 3
- 14 Thomas St
- 5 Thomas St
- 9 Thomas St
- 33 Anderson Ave
- 20 Morse Ave
- 11 Thomas St
- 29 Anderson Ave
- 225 Beach St Unit 3H
- 225 Beach St Unit 3G
- 225 Beach St Unit 3F
- 225 Beach St Unit 3E
Your Personal Tour Guide
Ask me questions while you tour the home.