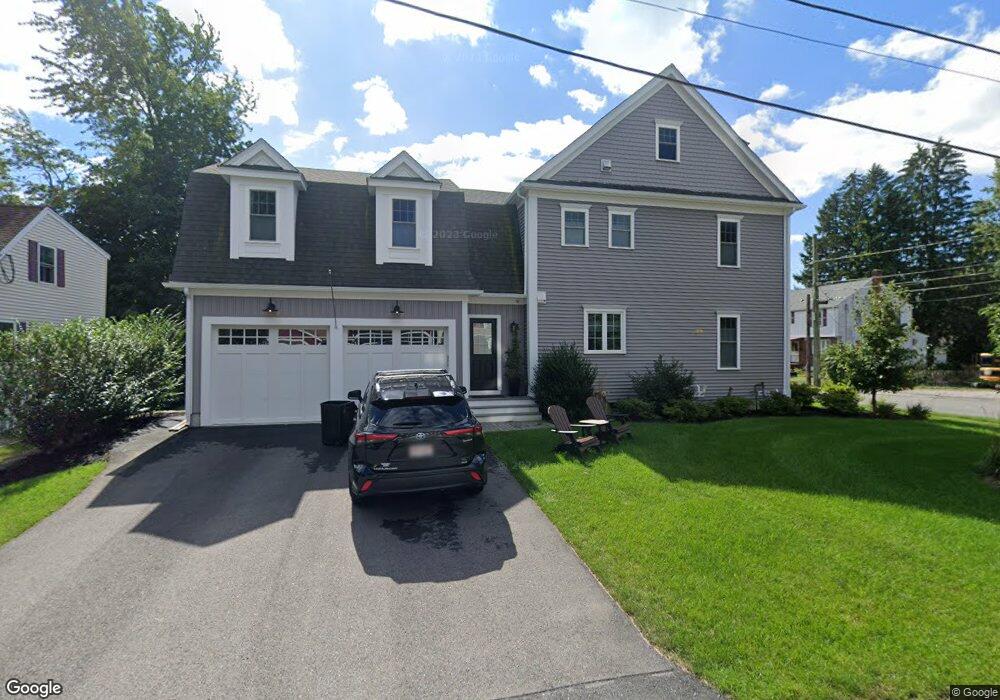
42 Morse St Natick, MA 01760
Estimated Value: $1,303,000 - $1,561,000
4
Beds
3
Baths
2,840
Sq Ft
$512/Sq Ft
Est. Value
About This Home
This home is located at 42 Morse St, Natick, MA 01760 and is currently estimated at $1,453,245, approximately $511 per square foot. 42 Morse St is a home located in Middlesex County with nearby schools including Natick High School, Lilja Elementary School, and Wilson Middle School.
Ownership History
Date
Name
Owned For
Owner Type
Purchase Details
Closed on
Feb 11, 2020
Sold by
Arthur Fine Homes Llc
Bought by
Levin Itamar and Levin Jennifer
Current Estimated Value
Home Financials for this Owner
Home Financials are based on the most recent Mortgage that was taken out on this home.
Original Mortgage
$600,000
Outstanding Balance
$532,664
Interest Rate
3.74%
Mortgage Type
New Conventional
Estimated Equity
$920,581
Purchase Details
Closed on
Dec 9, 2010
Sold by
Maude Emily J
Bought by
Maude Tr Emily J and Dunne Patrice M
Create a Home Valuation Report for This Property
The Home Valuation Report is an in-depth analysis detailing your home's value as well as a comparison with similar homes in the area
Home Values in the Area
Average Home Value in this Area
Purchase History
| Date | Buyer | Sale Price | Title Company |
|---|---|---|---|
| Levin Itamar | $1,045,000 | None Available | |
| Maude Tr Emily J | -- | -- |
Source: Public Records
Mortgage History
| Date | Status | Borrower | Loan Amount |
|---|---|---|---|
| Open | Levin Itamar | $600,000 |
Source: Public Records
Tax History
| Year | Tax Paid | Tax Assessment Tax Assessment Total Assessment is a certain percentage of the fair market value that is determined by local assessors to be the total taxable value of land and additions on the property. | Land | Improvement |
|---|---|---|---|---|
| 2025 | $15,847 | $1,325,000 | $418,700 | $906,300 |
| 2024 | $15,314 | $1,249,100 | $395,400 | $853,700 |
| 2023 | $14,551 | $1,151,200 | $372,200 | $779,000 |
| 2022 | $14,128 | $1,059,100 | $339,600 | $719,500 |
| 2021 | $13,455 | $988,600 | $321,000 | $667,600 |
| 2020 | $4,715 | $346,400 | $293,100 | $53,300 |
| 2019 | $4,403 | $346,400 | $293,100 | $53,300 |
| 2018 | $4,360 | $334,100 | $279,100 | $55,000 |
| 2017 | $4,553 | $337,500 | $246,600 | $90,900 |
| 2016 | $4,370 | $322,000 | $231,900 | $90,100 |
| 2015 | $4,352 | $314,900 | $231,900 | $83,000 |
Source: Public Records
Map
Nearby Homes
- 4 Chester St
- 2 Chester St
- 11 Avon St
- 10 Lincoln St Unit 10
- 6A Lincoln St Unit 6A
- 4B Lincoln St Unit 4B
- 3A Wilson St Unit 3A
- 3 Wilson St Unit 3B
- 12 Floral Ave
- 67 E Central St & 5 Union St
- 45 Summer St
- 6 Floral Avenue Extension
- 49 Summer St
- 63 Pond St
- 52 Washington St
- 14 Pinewood Ave
- 16 Harvard St
- 3 Vale St Unit A
- 75 Cottage St
- 20 Florence St Unit B
- 5 Chester St
- 44 Morse St
- 37 Morse St
- 37 Morse St Unit B
- 37 Morse St Unit A
- 41 Morse St
- 2 Allen St
- 7 Chester St
- 5 Lincoln Street Extension
- 8 Chester St
- 34 Morse St Unit B
- 38 Morse Unit B
- 34 Morse St Unit A
- 38 Morse Unit A
- 34 Morse St
- 36 Morse St Unit A
- 9 Lincoln Street Extension
- 3 Lincoln Street Extension
- 22 Jefferson St
- 4 Allen St Unit B
Your Personal Tour Guide
Ask me questions while you tour the home.