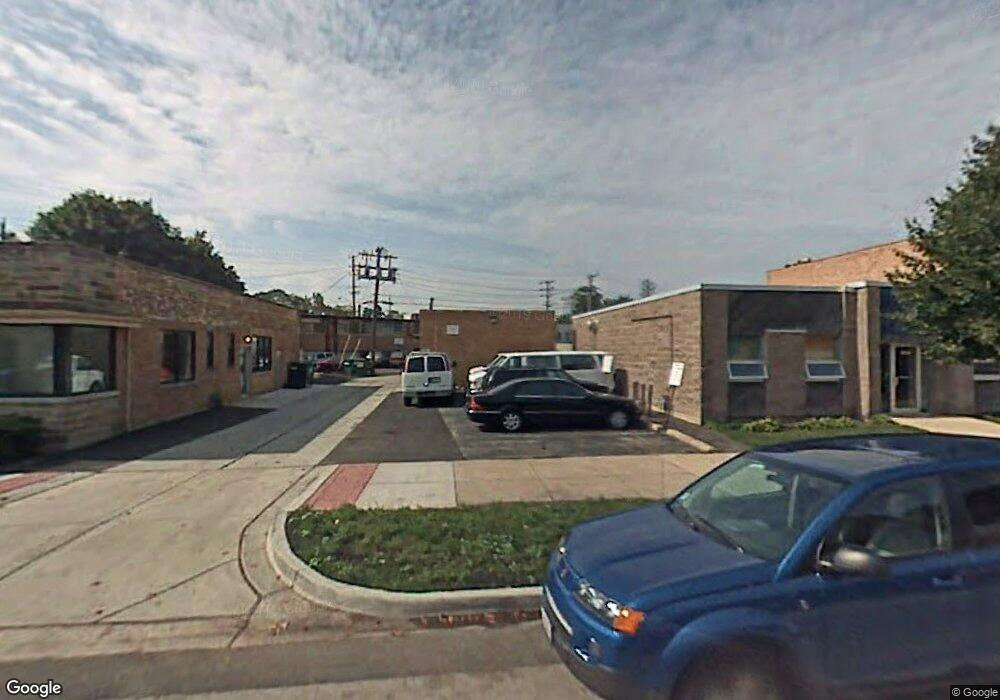
42 N Broadway St Des Plaines, IL 60016
Estimated Value: $262,911
--
Bed
--
Bath
1,009
Sq Ft
$261/Sq Ft
Est. Value
About This Home
This home is located at 42 N Broadway St, Des Plaines, IL 60016 and is currently estimated at $262,911, approximately $260 per square foot. 42 N Broadway St is a home located in Cook County with nearby schools including Cumberland Elementary School, Chippewa Middle School, and Maine West High School.
Ownership History
Date
Name
Owned For
Owner Type
Purchase Details
Closed on
Nov 28, 2018
Sold by
Rnwyz Llc
Bought by
Declaration Wyzukovicz Norma L and Norma L Wyzukovicz Declaration Of Tr
Current Estimated Value
Purchase Details
Closed on
Jul 29, 2013
Sold by
Malt Llc
Bought by
Rnwyz Llc
Purchase Details
Closed on
Jul 22, 2013
Sold by
Ls Property Development Llc
Bought by
Malt Llc
Purchase Details
Closed on
Dec 27, 2007
Sold by
Konken W Lee and Konken Sandra J
Bought by
Ls Property Development Llc
Purchase Details
Closed on
Jun 30, 1999
Sold by
Benge Eleanor C and Benge Tom L
Bought by
Konken Construction Inc
Purchase Details
Closed on
Nov 11, 1992
Sold by
Benge John and Benge Eleanor C
Bought by
Benge John and John Benge Jr Revocable Trust
Create a Home Valuation Report for This Property
The Home Valuation Report is an in-depth analysis detailing your home's value as well as a comparison with similar homes in the area
Home Values in the Area
Average Home Value in this Area
Purchase History
| Date | Buyer | Sale Price | Title Company |
|---|---|---|---|
| Declaration Wyzukovicz Norma L | -- | None Available | |
| Rnwyz Llc | $140,000 | Attorneys Title Guaranty Fun | |
| Malt Llc | $140,000 | Attorneys Title Guaranty Fun | |
| Ls Property Development Llc | -- | None Available | |
| Konken Construction Inc | $152,600 | -- | |
| Benge John | -- | -- |
Source: Public Records
Tax History Compared to Growth
Tax History
| Year | Tax Paid | Tax Assessment Tax Assessment Total Assessment is a certain percentage of the fair market value that is determined by local assessors to be the total taxable value of land and additions on the property. | Land | Improvement |
|---|---|---|---|---|
| 2024 | $8,196 | $31,088 | $8,138 | $22,950 |
| 2023 | $7,999 | $31,088 | $8,138 | $22,950 |
| 2022 | $7,999 | $31,088 | $8,138 | $22,950 |
| 2021 | $9,222 | $30,000 | $8,137 | $21,863 |
| 2020 | $9,066 | $30,000 | $8,137 | $21,863 |
| 2019 | $10,183 | $37,838 | $8,137 | $29,701 |
| 2018 | $11,693 | $39,099 | $4,650 | $34,449 |
| 2017 | $11,487 | $39,099 | $4,650 | $34,449 |
| 2016 | $10,865 | $39,099 | $4,650 | $34,449 |
| 2015 | $10,581 | $35,000 | $4,359 | $30,641 |
| 2014 | $10,358 | $35,000 | $4,359 | $30,641 |
| 2013 | $10,100 | $35,000 | $4,359 | $30,641 |
Source: Public Records
Map
Nearby Homes
- 52 N 6th Ave
- 758 Hanbury Dr Unit 66
- 760 Hanbury Dr Unit 65
- 39 N 5th Ave
- 154 Cornell Ave
- 955 Rand Rd
- 332 S Cumberland Pkwy
- 304 Amherst Ave
- 47 S Josephine Ct
- 805 North Ave
- 220 E Washington St
- 890 North Ave
- 732 Luau Dr
- 511 Bedford Ln
- 633 S George St
- 316 S Mount Prospect Rd
- 1108 Evergreen Ave
- 580 Concord Ln
- 21 W Bradley St
- 1057 Hollywood Ave
- 48 N Broadway St
- 38 N Broadway St
- 38 N Broadway St Unit 4
- 58 N Broadway St
- 60 N Broadway St
- 72 N Broadway St
- 72 N Broadway St
- 576 E Northwest Hwy Unit A
- 576 E Northwest Hwy
- 576 E Northwest Hwy
- 576 E Northwest Hwy
- 570 E Northwest Hwy
- 76 N Broadway St
- 76 N Broadway St
- 23 N Broadway St
- 550 E Northwest Hwy
- 69 N Broadway St Unit 69-73
- 613 Yale Ct
- 81 N Broadway St
- 612 Yale Ct