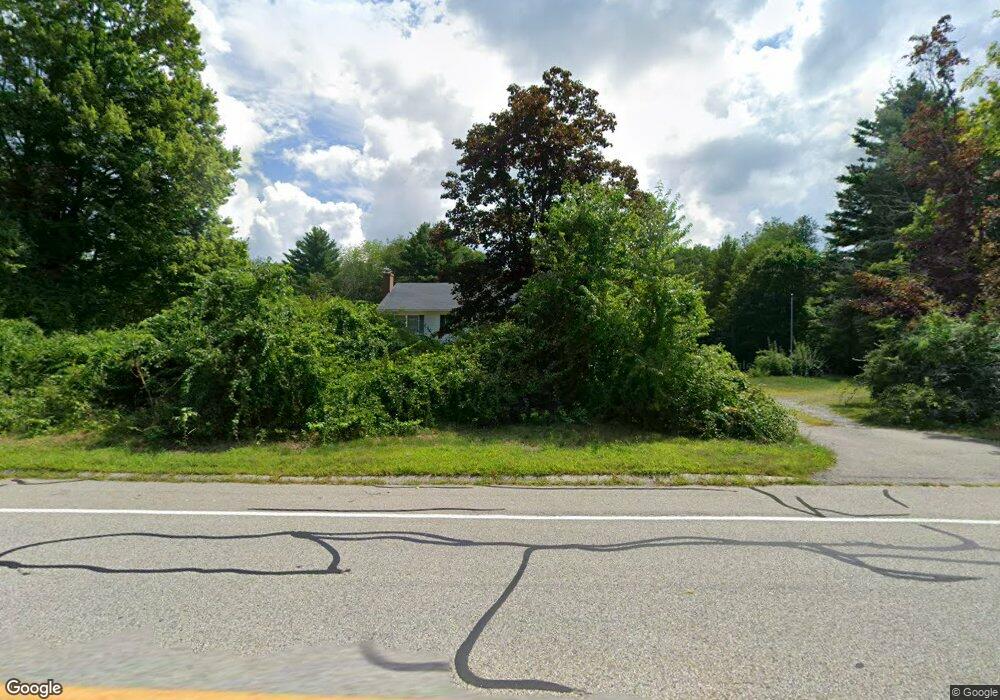
42 N Main St Petersham, MA 01366
Estimated Value: $496,000 - $646,000
3
Beds
3
Baths
2,664
Sq Ft
$213/Sq Ft
Est. Value
About This Home
This home is located at 42 N Main St, Petersham, MA 01366 and is currently estimated at $568,117, approximately $213 per square foot. 42 N Main St is a home located in Worcester County with nearby schools including Petersham Center, Ralph C Mahar Regional, and Petersham Montessori School.
Ownership History
Date
Name
Owned For
Owner Type
Purchase Details
Closed on
Dec 12, 2020
Sold by
Mchugh Timothy F
Bought by
Mchugh Kevin J and Mchugh Meghan
Current Estimated Value
Home Financials for this Owner
Home Financials are based on the most recent Mortgage that was taken out on this home.
Original Mortgage
$277,720
Outstanding Balance
$247,298
Interest Rate
2.71%
Mortgage Type
Purchase Money Mortgage
Estimated Equity
$320,819
Purchase Details
Closed on
Apr 4, 2012
Sold by
Mchugh Timothy F and Mchugh Leanne M
Bought by
Mchugh Timothy F
Home Financials for this Owner
Home Financials are based on the most recent Mortgage that was taken out on this home.
Original Mortgage
$279,000
Interest Rate
3%
Mortgage Type
Adjustable Rate Mortgage/ARM
Purchase Details
Closed on
Nov 28, 2005
Sold by
Tisdale Robert L and Tisdale Sandra E
Bought by
Mchugh Timothy F
Home Financials for this Owner
Home Financials are based on the most recent Mortgage that was taken out on this home.
Original Mortgage
$280,000
Interest Rate
6.06%
Mortgage Type
Purchase Money Mortgage
Purchase Details
Closed on
Aug 8, 1997
Sold by
Moore Mary D
Bought by
Tisdale Robert L and Tisdale Sandra E
Create a Home Valuation Report for This Property
The Home Valuation Report is an in-depth analysis detailing your home's value as well as a comparison with similar homes in the area
Home Values in the Area
Average Home Value in this Area
Purchase History
| Date | Buyer | Sale Price | Title Company |
|---|---|---|---|
| Mchugh Kevin J | $400,000 | None Available | |
| Mchugh Timothy F | -- | -- | |
| Mchugh Timothy F | $370,000 | -- | |
| Tisdale Robert L | $285,000 | -- |
Source: Public Records
Mortgage History
| Date | Status | Borrower | Loan Amount |
|---|---|---|---|
| Open | Mchugh Kevin J | $277,720 | |
| Previous Owner | Tisdale Robert L | $279,000 | |
| Previous Owner | Tisdale Robert L | $272,000 | |
| Previous Owner | Mchugh Timothy F | $280,000 |
Source: Public Records
Tax History Compared to Growth
Tax History
| Year | Tax Paid | Tax Assessment Tax Assessment Total Assessment is a certain percentage of the fair market value that is determined by local assessors to be the total taxable value of land and additions on the property. | Land | Improvement |
|---|---|---|---|---|
| 2025 | $6,212 | $428,700 | $69,600 | $359,100 |
| 2024 | $6,065 | $424,100 | $69,600 | $354,500 |
| 2023 | $5,523 | $349,800 | $66,800 | $283,000 |
| 2022 | $4,736 | $349,800 | $66,800 | $283,000 |
| 2021 | $5,182 | $338,500 | $60,700 | $277,800 |
| 2020 | $5,473 | $315,100 | $52,800 | $262,300 |
| 2019 | $5,267 | $311,100 | $46,200 | $264,900 |
| 2018 | $5,060 | $309,100 | $44,200 | $264,900 |
| 2017 | $4,906 | $303,000 | $46,200 | $256,800 |
| 2016 | $4,975 | $303,000 | $46,200 | $256,800 |
| 2015 | $5,094 | $299,800 | $45,800 | $254,000 |
| 2014 | $4,776 | $299,800 | $45,800 | $254,000 |
Source: Public Records
Map
Nearby Homes
- 19&21 Common St
- 15 Common St
- 32 West St
- 42 New Salem Rd
- 27 Popple Camp Rd
- 0 Popple Camp Rd Unit 73432026
- 163 Hardwick Rd
- 42 Glasheen Rd
- 204 East St
- 11-L New Athol Rd
- 12-L New Athol Rd
- 7-L New Athol Rd
- 47 Harty Dr
- 1327 Riceville Rd
- 0 Nichewaug Rd
- Back Lot 0 Petersham Rd
- 32 Edward Ln
- 31 Edward Ln
- 37 Gauthier Rd
- 420 Queen Lake Rd