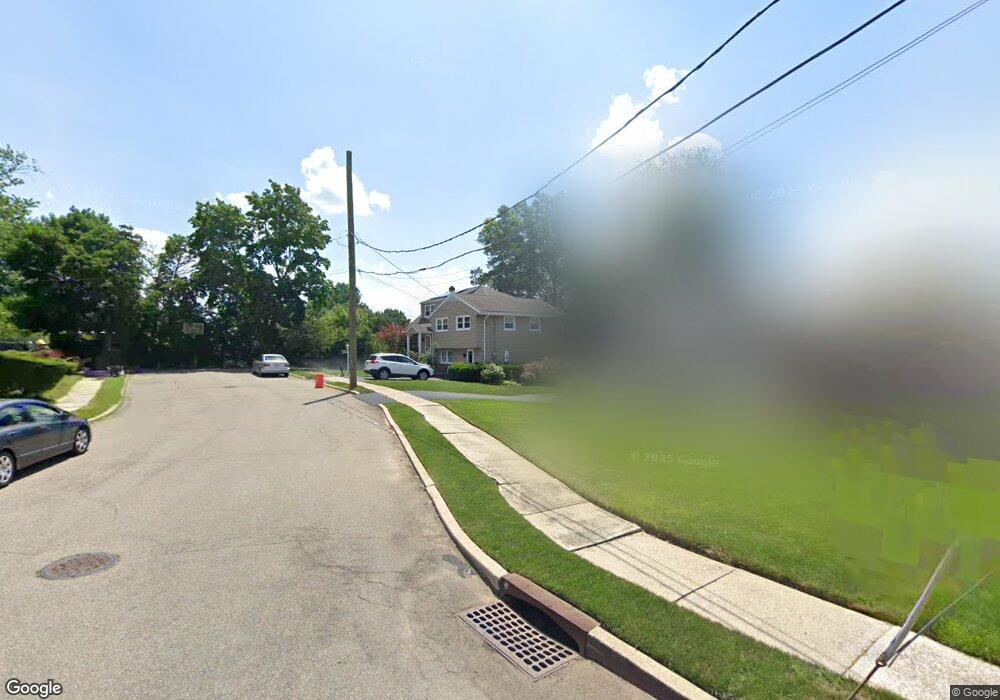
42 Nell Ct Dumont, NJ 07628
Estimated Value: $638,000 - $799,000
4
Beds
2
Baths
1,929
Sq Ft
$368/Sq Ft
Est. Value
About This Home
This home is located at 42 Nell Ct, Dumont, NJ 07628 and is currently estimated at $709,155, approximately $367 per square foot. 42 Nell Ct is a home located in Bergen County with nearby schools including Dumont High School.
Ownership History
Date
Name
Owned For
Owner Type
Purchase Details
Closed on
Jun 24, 2021
Sold by
Lanzana Frank and Lanzana Kimberly
Bought by
Bruno Caryn E
Current Estimated Value
Home Financials for this Owner
Home Financials are based on the most recent Mortgage that was taken out on this home.
Original Mortgage
$360,000
Outstanding Balance
$325,935
Interest Rate
2.9%
Mortgage Type
New Conventional
Estimated Equity
$383,220
Purchase Details
Closed on
May 1, 2017
Sold by
Lanzana Frank
Bought by
Lanzana Frank
Home Financials for this Owner
Home Financials are based on the most recent Mortgage that was taken out on this home.
Original Mortgage
$377,950
Interest Rate
4.14%
Mortgage Type
New Conventional
Purchase Details
Closed on
Jan 12, 2010
Sold by
Dangelo Farms Co
Bought by
Lanzana Frank
Purchase Details
Closed on
Mar 14, 2005
Create a Home Valuation Report for This Property
The Home Valuation Report is an in-depth analysis detailing your home's value as well as a comparison with similar homes in the area
Home Values in the Area
Average Home Value in this Area
Purchase History
| Date | Buyer | Sale Price | Title Company |
|---|---|---|---|
| Bruno Caryn E | $450,000 | Builders Title Agency Inc | |
| Lanzana Frank | -- | None Available | |
| Lanzana Frank | -- | -- | |
| Lanzana Frank | -- | -- | |
| -- | -- | -- |
Source: Public Records
Mortgage History
| Date | Status | Borrower | Loan Amount |
|---|---|---|---|
| Open | Bruno Caryn E | $360,000 | |
| Previous Owner | Lanzana Frank | $377,950 |
Source: Public Records
Tax History Compared to Growth
Tax History
| Year | Tax Paid | Tax Assessment Tax Assessment Total Assessment is a certain percentage of the fair market value that is determined by local assessors to be the total taxable value of land and additions on the property. | Land | Improvement |
|---|---|---|---|---|
| 2025 | $13,443 | $589,900 | $335,000 | $254,900 |
| 2024 | $13,112 | $330,700 | $180,000 | $150,700 |
| 2023 | $12,841 | $330,700 | $180,000 | $150,700 |
| 2022 | $12,841 | $330,700 | $180,000 | $150,700 |
| 2021 | $11,876 | $330,700 | $180,000 | $150,700 |
| 2020 | $12,431 | $330,700 | $180,000 | $150,700 |
| 2019 | $12,133 | $330,700 | $180,000 | $150,700 |
| 2018 | $11,885 | $330,700 | $180,000 | $150,700 |
| 2017 | $11,657 | $330,700 | $180,000 | $150,700 |
| 2016 | $11,386 | $330,700 | $180,000 | $150,700 |
| 2015 | $11,125 | $330,700 | $180,000 | $150,700 |
| 2014 | $10,906 | $330,700 | $180,000 | $150,700 |
Source: Public Records
Map
Nearby Homes
- 34 Nell Ct
- 26 Andover Ave
- 13 Beverly Rd
- 20 Andover Ave
- 32 Andover Ave
- 19 Beverly Rd
- 14 Andover Ave
- 33 Nell Ct
- 26 Nell Ct
- 25 Beverly Rd
- 1 Beverly Rd
- 29 Nell Ct
- 31 Beverly Rd
- 608 Washington Ave
- 6 Andover Ave
- 18 Nell Ct
- 622 Washington Ave
- 622 Washington Ave Unit Lower Level
- 622 Washington Ave Unit upper
- 25 Nell Ct