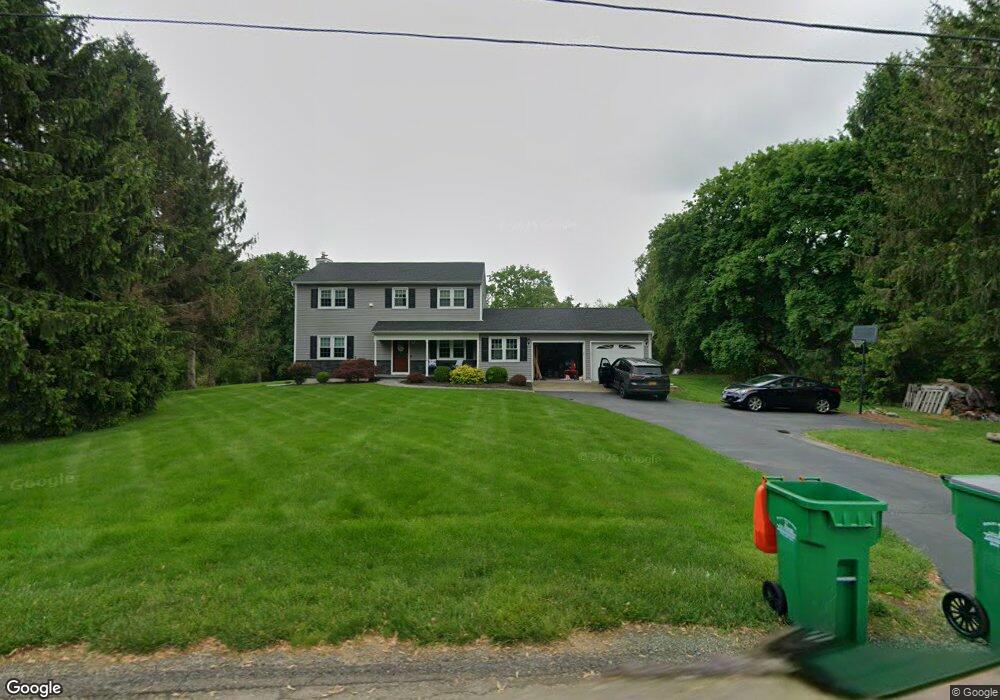
42 Ninham Ave Wappingers Falls, NY 12590
Estimated Value: $522,000 - $609,443
4
Beds
2
Baths
2,018
Sq Ft
$280/Sq Ft
Est. Value
About This Home
This home is located at 42 Ninham Ave, Wappingers Falls, NY 12590 and is currently estimated at $565,111, approximately $280 per square foot. 42 Ninham Ave is a home located in Dutchess County with nearby schools including Myers Corners Elementary School, Van Wyck Junior High School, and John Jay Senior High School.
Ownership History
Date
Name
Owned For
Owner Type
Purchase Details
Closed on
Feb 28, 2011
Sold by
Murphy Susan
Bought by
Menton Shaun
Current Estimated Value
Home Financials for this Owner
Home Financials are based on the most recent Mortgage that was taken out on this home.
Original Mortgage
$224,000
Outstanding Balance
$147,917
Interest Rate
4.76%
Mortgage Type
Purchase Money Mortgage
Estimated Equity
$417,194
Purchase Details
Closed on
Aug 11, 2005
Sold by
Vaidian Anil
Bought by
Murphy Richard
Purchase Details
Closed on
Mar 18, 2003
Sold by
Farruggella James
Bought by
Vaidian Anil
Create a Home Valuation Report for This Property
The Home Valuation Report is an in-depth analysis detailing your home's value as well as a comparison with similar homes in the area
Home Values in the Area
Average Home Value in this Area
Purchase History
| Date | Buyer | Sale Price | Title Company |
|---|---|---|---|
| Menton Shaun | $280,000 | -- | |
| Murphy Richard | $345,000 | Carl Barone | |
| Vaidian Anil | $303,500 | Dominick Penzetta |
Source: Public Records
Mortgage History
| Date | Status | Borrower | Loan Amount |
|---|---|---|---|
| Open | Menton Shaun | $224,000 |
Source: Public Records
Tax History Compared to Growth
Tax History
| Year | Tax Paid | Tax Assessment Tax Assessment Total Assessment is a certain percentage of the fair market value that is determined by local assessors to be the total taxable value of land and additions on the property. | Land | Improvement |
|---|---|---|---|---|
| 2024 | $11,987 | $482,800 | $78,000 | $404,800 |
| 2023 | $11,987 | $455,200 | $78,000 | $377,200 |
| 2022 | $11,789 | $413,800 | $78,000 | $335,800 |
| 2021 | $10,805 | $369,500 | $78,000 | $291,500 |
| 2020 | $8,013 | $342,100 | $78,000 | $264,100 |
| 2019 | $7,726 | $342,100 | $78,000 | $264,100 |
| 2018 | $7,327 | $322,700 | $78,000 | $244,700 |
| 2017 | $7,590 | $319,500 | $78,000 | $241,500 |
| 2016 | $7,622 | $319,500 | $78,000 | $241,500 |
| 2015 | -- | $319,500 | $78,000 | $241,500 |
| 2014 | -- | $319,500 | $78,000 | $241,500 |
Source: Public Records
Map
Nearby Homes