S
Landlord's Agent in 2020
Sharon Batteau
Diane Turton, Realtors-Spring Lake


Estimated Value: $2,151,643
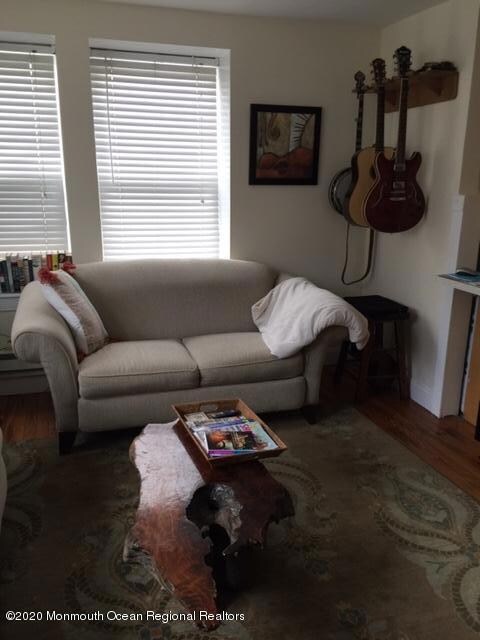
Sunny and spacious 2 bedroom 2 bath second floor annual rental, In Historic Ocean Grove.Open plan living room/kitchen, with plenty of storage. Master with En Suite bath, and washer/dryer.Two blocks to beautiful beaches! Steps to Main Street shops. Close to Asbury Park restaurants, events, and NYC trains.No smoking/vaping, no pets.
Last Agent to Rent the Property
Sharon Batteau
Diane Turton, Realtors-Spring Lake License #0452407 Listed on: 06/19/2020

Last Renter's Agent
Sharon Batteau
Diane Turton, Realtors-Ocean Grove
| Date | Buyer | Sale Price | Title Company |
|---|---|---|---|
| Ocean Sands Llc | $1,200,000 | -- | |
| Pathway Partners Llc | $450,000 | -- |
| Date | Status | Borrower | Loan Amount |
|---|---|---|---|
| Open | Ocean Sands Llc | $500,000 |
| Date | Event | Price | List to Sale | Price per Sq Ft |
|---|---|---|---|---|
| 10/12/2024 10/12/24 | Off Market | $950 | -- | -- |
| 10/07/2024 10/07/24 | For Rent | $950 | -56.8% | -- |
| 07/16/2020 07/16/20 | Rented | $2,200 | 0.0% | -- |
| 07/03/2020 07/03/20 | Price Changed | $2,200 | -2.2% | -- |
| 07/03/2020 07/03/20 | Under Contract | -- | -- | -- |
| 06/19/2020 06/19/20 | For Rent | $2,250 | +21.6% | -- |
| 02/01/2017 02/01/17 | Rented | $1,850 | +15.6% | -- |
| 04/02/2014 04/02/14 | Rented | $1,600 | +6.7% | -- |
| 06/18/2012 06/18/12 | Rented | $1,500 | -- | -- |
| Year | Tax Paid | Tax Assessment Tax Assessment Total Assessment is a certain percentage of the fair market value that is determined by local assessors to be the total taxable value of land and additions on the property. | Land | Improvement |
|---|---|---|---|---|
| 2025 | $20,169 | $1,489,300 | $753,200 | $736,100 |
| 2024 | $20,217 | $1,173,300 | $437,200 | $736,100 |
| 2023 | $20,217 | $1,139,600 | $563,800 | $575,800 |
| 2022 | $18,014 | $954,000 | $378,200 | $575,800 |
| 2021 | $18,014 | $867,300 | $378,200 | $489,100 |
| 2020 | $18,083 | $867,300 | $378,200 | $489,100 |
| 2019 | $18,326 | $867,300 | $378,200 | $489,100 |
| 2018 | $18,517 | $867,300 | $378,200 | $489,100 |
| 2017 | $18,905 | $849,300 | $360,200 | $489,100 |
| 2016 | $18,357 | $823,200 | $334,100 | $489,100 |
| 2015 | $16,458 | $751,500 | $262,400 | $489,100 |
| 2014 | $16,150 | $606,000 | $226,200 | $379,800 |
S
Landlord's Agent in 2020
Sharon Batteau
Diane Turton, Realtors-Spring Lake
Buyer's Agent in 2012
Kathryn Ward Grabowy
Douglas Elliman of NJ LLC
(732) 259-5505
42 Total Sales
Source: MOREMLS (Monmouth Ocean Regional REALTORS®)
MLS Number: 22020077
APN: 35-00148-0000-00005
Disclaimer: Certain information contained herein is derived from information provided by parties other than Homes.com. All information provided is deemed reliable, but is not guaranteed to be accurate and should be independently verified.
![]() IDX information is provided exclusively for personal, non-commercial use, and may not be used for any purpose other than to identify prospective properties consumers may be interested in purchasing.
IDX information is provided exclusively for personal, non-commercial use, and may not be used for any purpose other than to identify prospective properties consumers may be interested in purchasing.
Information is deemed reliable but not guaranteed.