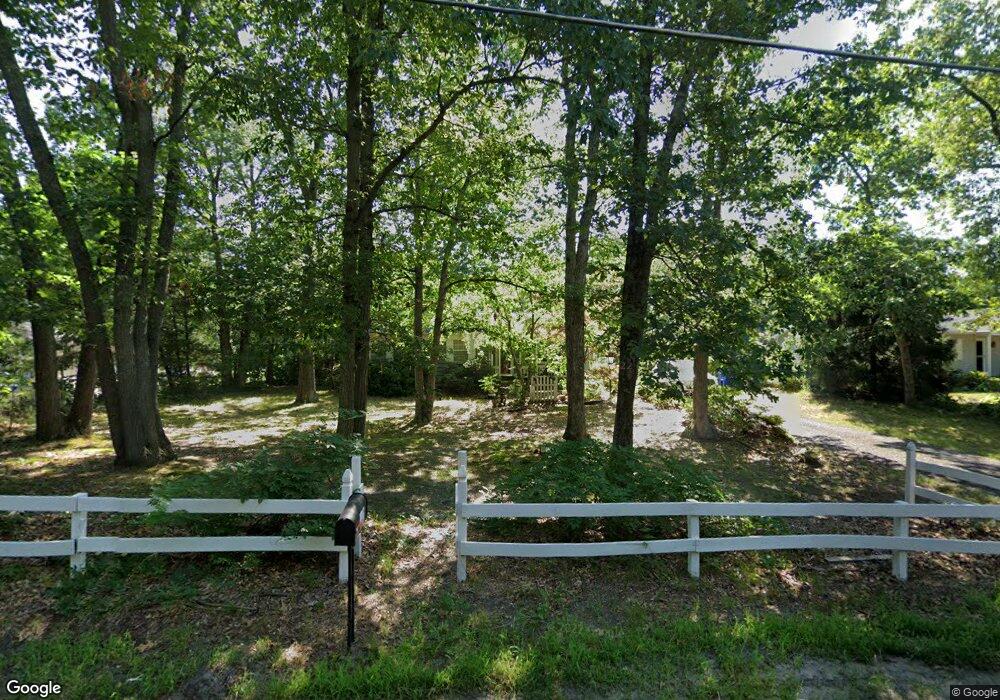
42 Richter Rd Tabernacle, NJ 08088
Estimated Value: $283,783 - $383,000
Studio
--
Bath
1,004
Sq Ft
$326/Sq Ft
Est. Value
About This Home
This home is located at 42 Richter Rd, Tabernacle, NJ 08088 and is currently estimated at $327,446, approximately $326 per square foot. 42 Richter Rd is a home located in Burlington County with nearby schools including Tabernacle Elementary School, Kenneth R Olson Mid School, and Seneca High School.
Ownership History
Date
Name
Owned For
Owner Type
Purchase Details
Closed on
Aug 15, 2012
Sold by
Smith John J and Smith June B
Bought by
Smith Jeffrey E
Current Estimated Value
Home Financials for this Owner
Home Financials are based on the most recent Mortgage that was taken out on this home.
Original Mortgage
$119,000
Outstanding Balance
$81,854
Interest Rate
3.52%
Mortgage Type
New Conventional
Estimated Equity
$245,592
Purchase Details
Closed on
Apr 9, 2010
Sold by
Smith John H and Smith June B
Bought by
Smith Jeffrey E
Purchase Details
Closed on
Sep 8, 1995
Sold by
Aiello Dolores
Bought by
Smith John H and Smith June B
Create a Home Valuation Report for This Property
The Home Valuation Report is an in-depth analysis detailing your home's value as well as a comparison with similar homes in the area
Home Values in the Area
Average Home Value in this Area
Purchase History
| Date | Buyer | Sale Price | Title Company |
|---|---|---|---|
| Smith Jeffrey E | -- | Southern United Title Agency | |
| Smith Jeffrey E | -- | None Available | |
| Smith John H | $119,000 | -- |
Source: Public Records
Mortgage History
| Date | Status | Borrower | Loan Amount |
|---|---|---|---|
| Open | Smith Jeffrey E | $119,000 |
Source: Public Records
Tax History
| Year | Tax Paid | Tax Assessment Tax Assessment Total Assessment is a certain percentage of the fair market value that is determined by local assessors to be the total taxable value of land and additions on the property. | Land | Improvement |
|---|---|---|---|---|
| 2025 | $4,753 | $143,500 | $55,000 | $88,500 |
| 2024 | $4,354 | $143,500 | $55,000 | $88,500 |
| 2023 | $4,354 | $143,500 | $55,000 | $88,500 |
| 2022 | $4,222 | $143,500 | $55,000 | $88,500 |
| 2021 | $4,296 | $143,500 | $55,000 | $88,500 |
| 2020 | $4,352 | $143,500 | $55,000 | $88,500 |
| 2019 | $4,222 | $143,500 | $55,000 | $88,500 |
| 2018 | $4,144 | $143,500 | $55,000 | $88,500 |
| 2017 | $4,118 | $143,500 | $55,000 | $88,500 |
| 2016 | $3,991 | $143,500 | $55,000 | $88,500 |
| 2015 | $3,956 | $143,500 | $55,000 | $88,500 |
| 2014 | $3,800 | $143,500 | $55,000 | $88,500 |
Source: Public Records
Map
Nearby Homes
Your Personal Tour Guide
Ask me questions while you tour the home.