42 Skipjack Way Brewster, MA 02631
Estimated Value: $694,000 - $946,000
3
Beds
2
Baths
1,236
Sq Ft
$667/Sq Ft
Est. Value
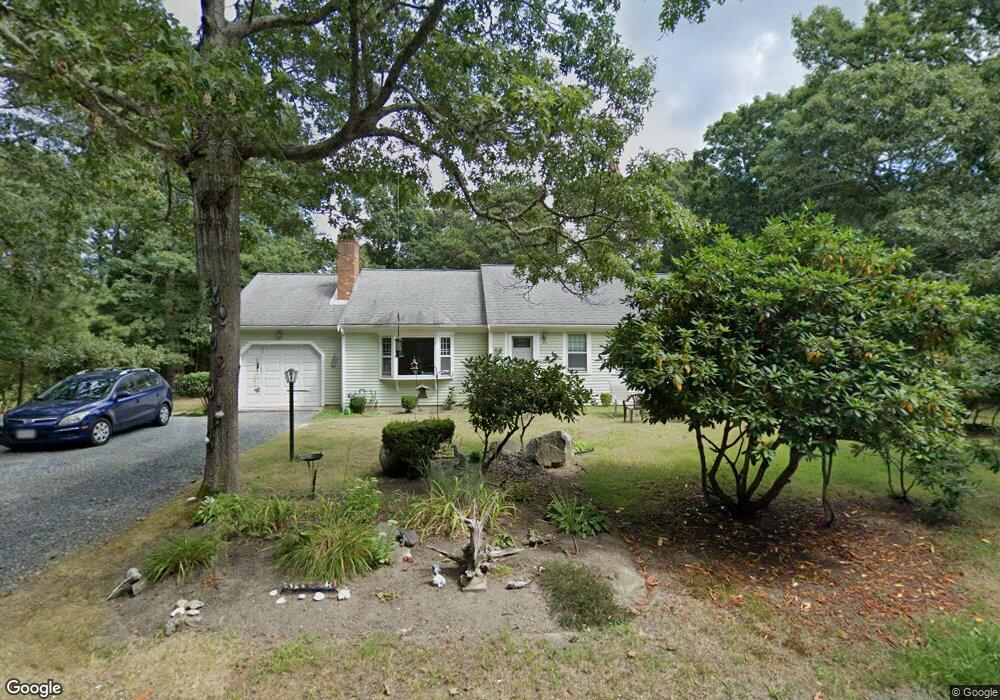
About This Home
This home is located at 42 Skipjack Way, Brewster, MA 02631 and is currently estimated at $824,856, approximately $667 per square foot. 42 Skipjack Way is a home located in Barnstable County with nearby schools including Stony Brook Elementary School, Eddy Elementary School, and Nauset Regional Middle School.
Ownership History
Date
Name
Owned For
Owner Type
Purchase Details
Closed on
Jul 9, 2010
Sold by
Mullin James F
Bought by
Mullin T
Current Estimated Value
Purchase Details
Closed on
Oct 22, 2008
Sold by
Mullin James F and Lundgren Marsha M
Bought by
Mullin James F
Home Financials for this Owner
Home Financials are based on the most recent Mortgage that was taken out on this home.
Original Mortgage
$210,000
Interest Rate
5.94%
Create a Home Valuation Report for This Property
The Home Valuation Report is an in-depth analysis detailing your home's value as well as a comparison with similar homes in the area
Home Values in the Area
Average Home Value in this Area
Purchase History
| Date | Buyer | Sale Price | Title Company |
|---|---|---|---|
| Mullin T | -- | -- | |
| Mullin James F | -- | -- |
Source: Public Records
Mortgage History
| Date | Status | Borrower | Loan Amount |
|---|---|---|---|
| Previous Owner | Mullin James F | $210,000 |
Source: Public Records
Tax History Compared to Growth
Tax History
| Year | Tax Paid | Tax Assessment Tax Assessment Total Assessment is a certain percentage of the fair market value that is determined by local assessors to be the total taxable value of land and additions on the property. | Land | Improvement |
|---|---|---|---|---|
| 2025 | $4,938 | $717,700 | $396,700 | $321,000 |
| 2024 | $4,614 | $677,500 | $374,300 | $303,200 |
| 2023 | $4,531 | $648,200 | $373,400 | $274,800 |
| 2022 | $4,248 | $541,100 | $311,100 | $230,000 |
| 2021 | $3,834 | $446,900 | $242,000 | $204,900 |
| 2020 | $3,332 | $386,500 | $192,200 | $194,300 |
| 2019 | $3,214 | $374,600 | $184,800 | $189,800 |
| 2018 | $2,086 | $367,200 | $184,800 | $182,400 |
| 2017 | $2,900 | $345,600 | $184,800 | $160,800 |
| 2016 | $2,859 | $339,100 | $181,200 | $157,900 |
| 2015 | $2,757 | $333,800 | $177,700 | $156,100 |
Source: Public Records
Map
Nearby Homes
- 20 Skipjack Way
- 104 Sachemus Trail Unit 104
- 42 Landing Ln Unit 42
- 126 Bittersweet Dr
- 46 Court Way
- 28 Middlecott Ln
- 85 Yankee Dr
- 82 Middlecott Ln
- 105 Middlecott Ln Unit 105
- 1861 Main St
- 14 Billington Ln Unit 14
- 43 Billington Ln
- 43 Billington Ln Unit 43
- 195 Ellis Landing Rd
- 277 Lund Farm Way
- 410 Blueberry Pond Dr
- 11 Juniper Cir
- 60 Fletcher Ln Unit H
- 60 Fletcher Ln Unit C
- 61 Fletcher Ln Unit H