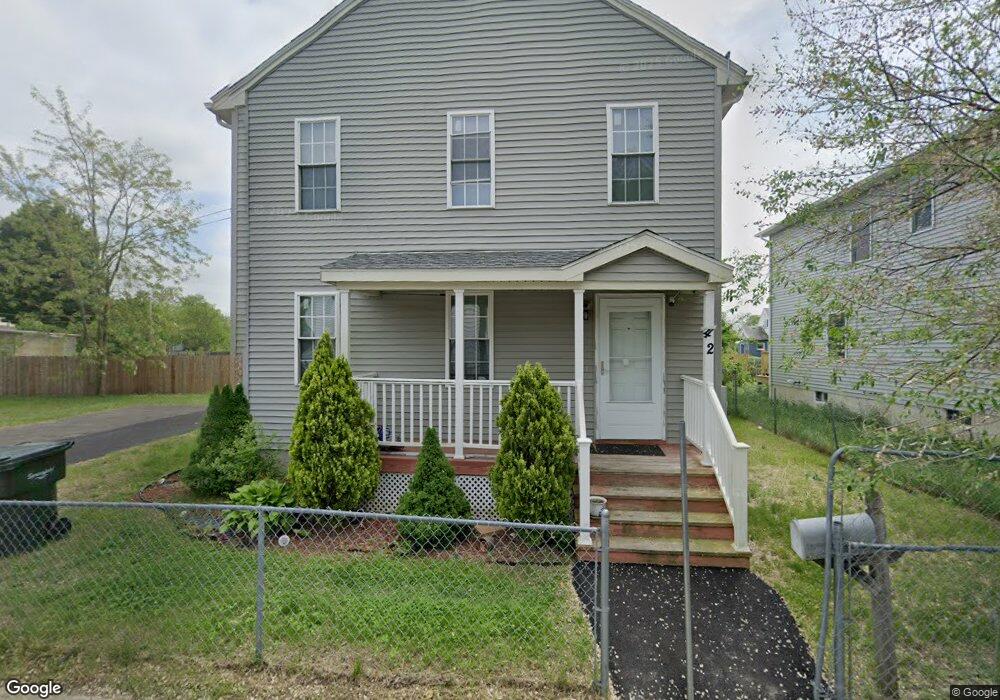
42 Spruce St Springfield, MA 01105
Maple-High Six Corners NeighborhoodEstimated Value: $237,000 - $278,018
3
Beds
2
Baths
1,248
Sq Ft
$209/Sq Ft
Est. Value
About This Home
This home is located at 42 Spruce St, Springfield, MA 01105 and is currently estimated at $260,255, approximately $208 per square foot. 42 Spruce St is a home located in Hampden County with nearby schools including Elias Brookings School, M Marcus Kiley Middle, and High School Of Commerce.
Ownership History
Date
Name
Owned For
Owner Type
Purchase Details
Closed on
Dec 18, 2003
Sold by
Mireku Francis A and Anane Francis
Bought by
Mireku Comfort A and Mireku Francis A
Current Estimated Value
Home Financials for this Owner
Home Financials are based on the most recent Mortgage that was taken out on this home.
Original Mortgage
$77,000
Outstanding Balance
$35,880
Interest Rate
5.96%
Mortgage Type
Purchase Money Mortgage
Estimated Equity
$224,375
Purchase Details
Closed on
Nov 20, 1990
Sold by
Author Sprngfld Redev
Bought by
Anane Francis M
Home Financials for this Owner
Home Financials are based on the most recent Mortgage that was taken out on this home.
Original Mortgage
$72,600
Interest Rate
10.03%
Mortgage Type
Purchase Money Mortgage
Create a Home Valuation Report for This Property
The Home Valuation Report is an in-depth analysis detailing your home's value as well as a comparison with similar homes in the area
Home Values in the Area
Average Home Value in this Area
Purchase History
| Date | Buyer | Sale Price | Title Company |
|---|---|---|---|
| Mireku Comfort A | -- | -- | |
| Anane Francis M | $76,500 | -- |
Source: Public Records
Mortgage History
| Date | Status | Borrower | Loan Amount |
|---|---|---|---|
| Open | Mireku Comfort A | $77,000 | |
| Previous Owner | Anane Francis M | $10,000 | |
| Previous Owner | Anane Francis M | $10,000 | |
| Previous Owner | Anane Francis M | $72,600 |
Source: Public Records
Tax History
| Year | Tax Paid | Tax Assessment Tax Assessment Total Assessment is a certain percentage of the fair market value that is determined by local assessors to be the total taxable value of land and additions on the property. | Land | Improvement |
|---|---|---|---|---|
| 2025 | $3,269 | $208,500 | $25,700 | $182,800 |
| 2024 | $3,271 | $203,700 | $24,000 | $179,700 |
| 2023 | $2,921 | $171,300 | $22,800 | $148,500 |
| 2022 | $3,132 | $166,400 | $20,800 | $145,600 |
| 2021 | $3,258 | $172,400 | $18,900 | $153,500 |
| 2020 | $2,826 | $144,700 | $18,900 | $125,800 |
| 2019 | $2,712 | $137,800 | $18,900 | $118,900 |
| 2018 | $2,614 | $132,800 | $18,900 | $113,900 |
| 2017 | $2,159 | $109,800 | $15,100 | $94,700 |
| 2016 | $2,084 | $106,000 | $15,100 | $90,900 |
| 2015 | $2,142 | $108,900 | $15,100 | $93,800 |
Source: Public Records
Map
Nearby Homes
Your Personal Tour Guide
Ask me questions while you tour the home.