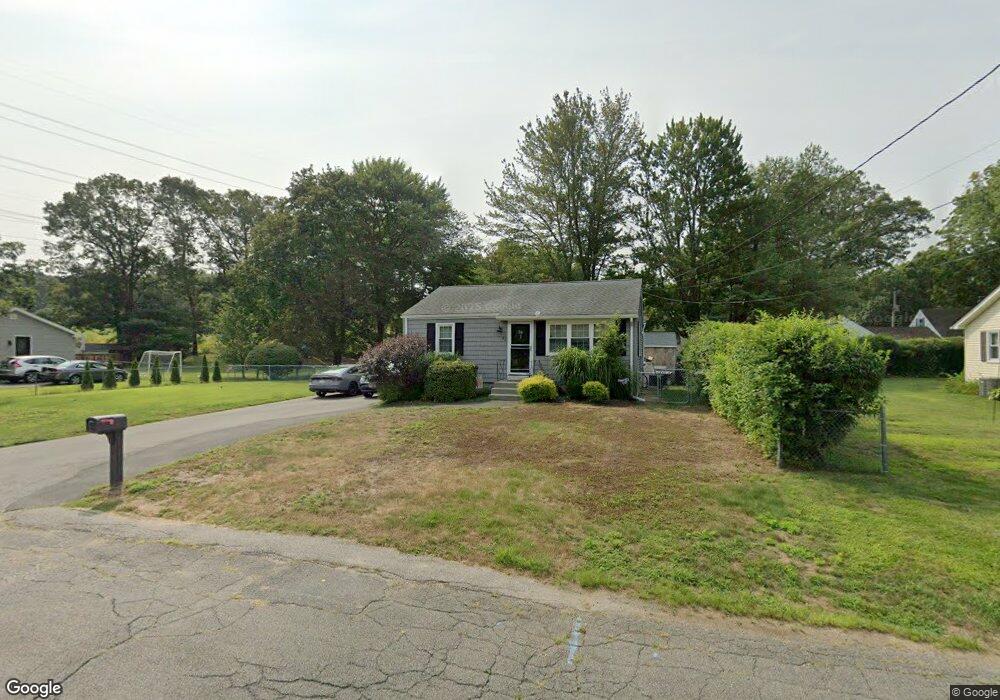
42 Stanley St Ludlow, MA 01056
Estimated Value: $263,000 - $330,000
2
Beds
1
Bath
720
Sq Ft
$393/Sq Ft
Est. Value
About This Home
This home is located at 42 Stanley St, Ludlow, MA 01056 and is currently estimated at $283,177, approximately $393 per square foot. 42 Stanley St is a home located in Hampden County with nearby schools including East Street Elementary School, Chapin Street Elementary School, and Paul R. Baird Middle School.
Ownership History
Date
Name
Owned For
Owner Type
Purchase Details
Closed on
Feb 26, 2010
Sold by
Obrien Stephen M and Obrien Julie L
Bought by
Vanwart Bridgete M
Current Estimated Value
Home Financials for this Owner
Home Financials are based on the most recent Mortgage that was taken out on this home.
Original Mortgage
$155,138
Outstanding Balance
$102,681
Interest Rate
5.11%
Mortgage Type
Purchase Money Mortgage
Estimated Equity
$180,496
Purchase Details
Closed on
Aug 13, 2003
Sold by
Purda Dolores M and Purda Stanley E
Bought by
Gilmore Cynthia M and Gilmore John D
Home Financials for this Owner
Home Financials are based on the most recent Mortgage that was taken out on this home.
Original Mortgage
$180,405
Interest Rate
5.46%
Mortgage Type
Purchase Money Mortgage
Purchase Details
Closed on
Feb 21, 2002
Sold by
Chenevert Dawn M
Bought by
Obrien Stephen M and Obrien Julie L
Home Financials for this Owner
Home Financials are based on the most recent Mortgage that was taken out on this home.
Original Mortgage
$110,200
Interest Rate
7.08%
Mortgage Type
Purchase Money Mortgage
Purchase Details
Closed on
Jul 27, 1999
Sold by
Jesus Mario R and Monaco Domenica M
Bought by
Chenevert Stanley
Home Financials for this Owner
Home Financials are based on the most recent Mortgage that was taken out on this home.
Original Mortgage
$87,755
Interest Rate
7.49%
Mortgage Type
Purchase Money Mortgage
Create a Home Valuation Report for This Property
The Home Valuation Report is an in-depth analysis detailing your home's value as well as a comparison with similar homes in the area
Home Values in the Area
Average Home Value in this Area
Purchase History
| Date | Buyer | Sale Price | Title Company |
|---|---|---|---|
| Vanwart Bridgete M | $158,000 | -- | |
| Vanwart Bridgete M | $158,000 | -- | |
| Gilmore Cynthia M | $189,900 | -- | |
| Obrien Stephen M | $116,000 | -- | |
| Obrien Stephen M | $116,000 | -- | |
| Chenevert Stanley | $87,800 | -- | |
| Chenevert Stanley | $87,800 | -- |
Source: Public Records
Mortgage History
| Date | Status | Borrower | Loan Amount |
|---|---|---|---|
| Open | Vanwart Bridgete M | $155,138 | |
| Closed | Chenevert Stanley | $155,138 | |
| Previous Owner | Gilmore Cynthia M | $180,405 | |
| Previous Owner | Obrien Stephen M | $110,200 | |
| Previous Owner | Chenevert Stanley | $87,755 |
Source: Public Records
Tax History
| Year | Tax Paid | Tax Assessment Tax Assessment Total Assessment is a certain percentage of the fair market value that is determined by local assessors to be the total taxable value of land and additions on the property. | Land | Improvement |
|---|---|---|---|---|
| 2025 | $3,355 | $193,400 | $74,000 | $119,400 |
| 2024 | $3,242 | $179,200 | $74,000 | $105,200 |
| 2023 | $3,012 | $154,400 | $64,900 | $89,500 |
| 2022 | $2,897 | $144,900 | $64,900 | $80,000 |
| 2021 | $2,924 | $138,700 | $64,900 | $73,800 |
| 2020 | $2,806 | $136,100 | $64,000 | $72,100 |
| 2019 | $2,585 | $130,400 | $63,300 | $67,100 |
| 2018 | $2,431 | $127,900 | $63,300 | $64,600 |
| 2017 | $2,342 | $126,400 | $61,500 | $64,900 |
| 2016 | $2,208 | $121,800 | $60,200 | $61,600 |
| 2015 | $2,092 | $121,000 | $59,600 | $61,400 |
Source: Public Records
Map
Nearby Homes
- 482 Holyoke St
- 350 West St Unit 3
- 350 West St Unit 19
- 350 West St Unit 17
- 14 Arthur St
- 47 Kendall St
- 382 Holyoke St
- 15 Hilltop Terrace
- 42 Roy St
- Lot 602 Grandview Ave
- 12 Mariana Ln
- 57 Belmont St
- 59 Prospect Gardens
- 119 Blisswood Village Dr
- 83 Loomis Dr
- 98 Fuller St Unit 32
- 70 Fuller St
- 102 Swan Ave
- 0 Fuller St Unit 73409741
- 42 Loopley St
Your Personal Tour Guide
Ask me questions while you tour the home.