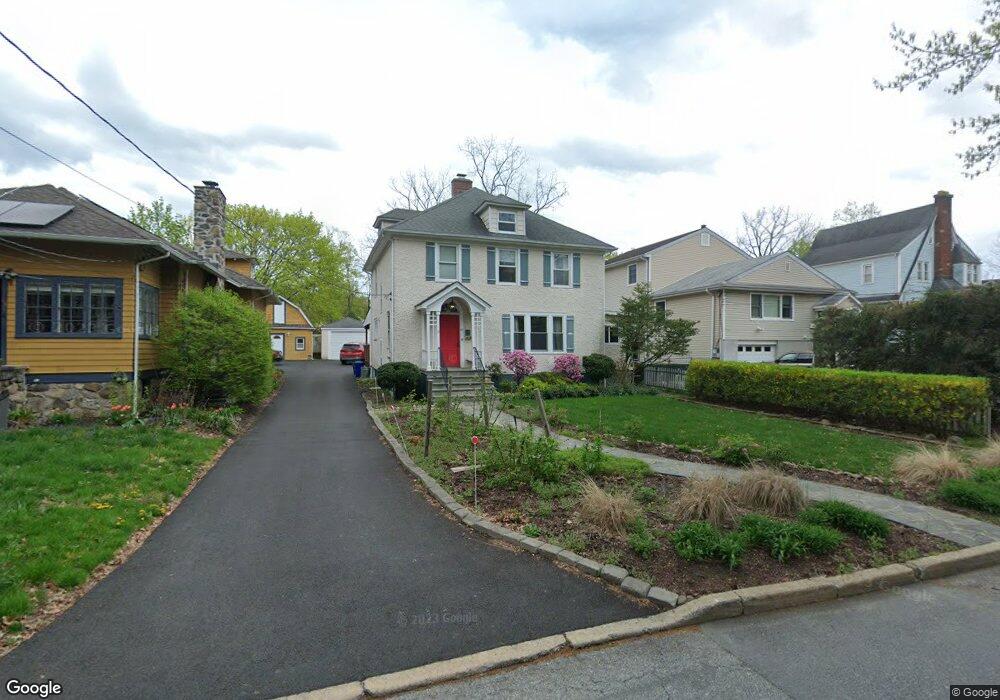
42 Stone Ave Ossining, NY 10562
Estimated Value: $597,000 - $752,000
4
Beds
1
Bath
1,800
Sq Ft
$386/Sq Ft
Est. Value
About This Home
This home is located at 42 Stone Ave, Ossining, NY 10562 and is currently estimated at $694,475, approximately $385 per square foot. 42 Stone Ave is a home located in Westchester County with nearby schools including Park School, Roosevelt Elementary School, and Brookside Elementary School.
Ownership History
Date
Name
Owned For
Owner Type
Purchase Details
Closed on
Apr 29, 2019
Sold by
Rowe Blake and Feldman Sharon
Bought by
Swan Andrew and Graeber Kristina
Current Estimated Value
Home Financials for this Owner
Home Financials are based on the most recent Mortgage that was taken out on this home.
Original Mortgage
$408,000
Outstanding Balance
$357,250
Interest Rate
4%
Mortgage Type
New Conventional
Estimated Equity
$337,225
Purchase Details
Closed on
Mar 5, 1999
Sold by
Kouril Kenneth F and Kouril Paula
Bought by
Rowe Blake and Feldman Sharon
Home Financials for this Owner
Home Financials are based on the most recent Mortgage that was taken out on this home.
Original Mortgage
$171,375
Interest Rate
6.78%
Create a Home Valuation Report for This Property
The Home Valuation Report is an in-depth analysis detailing your home's value as well as a comparison with similar homes in the area
Home Values in the Area
Average Home Value in this Area
Purchase History
| Date | Buyer | Sale Price | Title Company |
|---|---|---|---|
| Swan Andrew | $510,000 | Premier Abstract Ltd | |
| Rowe Blake | $228,500 | Chicago Title Insurance Co |
Source: Public Records
Mortgage History
| Date | Status | Borrower | Loan Amount |
|---|---|---|---|
| Open | Swan Andrew | $408,000 | |
| Previous Owner | Rowe Blake | $171,375 |
Source: Public Records
Tax History
| Year | Tax Paid | Tax Assessment Tax Assessment Total Assessment is a certain percentage of the fair market value that is determined by local assessors to be the total taxable value of land and additions on the property. | Land | Improvement |
|---|---|---|---|---|
| 2024 | $20,901 | $648,500 | $166,800 | $481,700 |
| 2023 | $20,337 | $611,000 | $166,800 | $444,200 |
| 2022 | $20,157 | $560,900 | $166,800 | $394,100 |
| 2021 | $17,721 | $500,800 | $166,800 | $334,000 |
| 2020 | $20,576 | $500,800 | $166,800 | $334,000 |
| 2019 | $19,794 | $488,800 | $166,800 | $322,000 |
| 2018 | $15,796 | $433,800 | $158,400 | $275,400 |
| 2017 | $8,666 | $425,400 | $158,400 | $267,000 |
| 2016 | $158,176 | $417,100 | $158,400 | $258,700 |
| 2015 | $8,947 | $19,550 | $5,500 | $14,050 |
| 2014 | $8,947 | $19,550 | $5,500 | $14,050 |
| 2013 | $8,947 | $19,550 | $5,500 | $14,050 |
Source: Public Records
Map
Nearby Homes
- 10 Pine Brook Rd
- 42 Campwoods Grounds
- 15 Marshall Place
- 1C Calam Ave
- 16 Robin St
- 7 Hawkes Ave
- 48 Pershing Ave
- 132 Croton Ave
- 41 Croton Dam Rd
- 19 Donald Ln
- 7 Grandview Ave
- 36 Watson Ave
- 38 Terrace Ave
- 33 Ryder Rd
- 59 Watson Ave
- 76 Hawkes Ave
- 200 Route 9a
- 1 Noel Dr
- 46 Hudson View Hill Unit 46
- 42 Brooke View Dr
Your Personal Tour Guide
Ask me questions while you tour the home.